| This article is part of a series on the |
| Indian National Congress |
|---|
 |
| About |
| Committees |
| Frontals |
| Alliances |
| International affiliation |
Since independence, the Indian National Congress has participated in elections, Lok Sabha and Vidhan Sabha. This article shows a list of the results of the elections for Congress.
| Year | Number of Seats | Remarks |
|---|---|---|
| 1952 | 146 | |
| 1952-1954 | 164 | |
| 1954-1956 | 186 | |
| 1956-1958 | 177 | |
| 1958-1960 | 173 | |
| 1960-1962 | 164 | |
| 1962-1964 | 162 | |
| 1964-1966 | 166 | |
| 1966-1968 | 140 | |
| 1968-1970 | 141 | INC(I)-99
INC(o)-42 |
| 1970-1972 | 132 | INC(I)-107
INC(o)-25 |
| 1972-1974 | 142 | INC(I)-128
INC(O)-14 |
| 1974-1976 | 153 | INC(I)-146
INC(O)-7 |
| 1976-1978 | 136 | INC(I)-72
INC(O)-64 |
| 1978-1980 | 113 | INC(I)-65
INC(O)-48 |
| 1980-1982 | 124 | |
| 1982-1984 | 152 | |
| 1984-1986 | 159 | |
| 1986-1988 | 141 | |
| 1988-1990 | 108 | |
| 1990-1992 | 99 | |
| 1992-1994 | 95 | |
| 1994-1996 | 85 | |
| 1996-1998 | 65 | |
| 1998-2000 | 57 | |
| 2000-2002 | 58 | |
| 2002-2004 | 64 | |
| 2004-2006 | 73 | |
| 2006-2008 | 72 | |
| 2008-2010 | 71 | |
| 2010-2012 | 71 | |
| 2012-2014 | 69 | |
| 2014-2016 | 60 | |
| 2016-2018 | 50 |
Andhra Pradesh
Legislative Assembly Elections
As Hyderabad State
| Year | Legislature | Leader | Seats Contested | Seats won | Votes | Percentage of votes | Outcome |
|---|---|---|---|---|---|---|---|
| 1952 | 1st Assembly | Burgula Ramakrishna Rao | 173 | 93 / 175 |
21,77,716 | 41.86 | Government |
As Andhra Pradesh
| Year | Legislature | Leader | Seats Contested | Seats won | Change in seats | Votes | Percentage of votes | Vote swing | Outcome |
|---|---|---|---|---|---|---|---|---|---|
| 1955 | 2nd Assembly | B. Gopala Reddy | 142 | 119 / 196 |
- | 3,394,109 | 39.35 | - | Government |
| 1957 | 3rd Assembly | Neelam Sanjiva Reddy | 109 | 68 / 109 |
- | 17,07,364 | 47.38 | - | Government |
| 1962 | 4th Assembly | Neelam Sanjiva Reddy | 300 | 177 / 300 |
5,523,359 | 47.25 | Government | ||
| 1967 | 5th Assembly | Kasu Brahmananda Reddy | 287 | 165 / 287 |
6,292,649 | 45.42 | Government | ||
| 1972 | 6th Assembly | P. V. Narasimha Rao | 287 | 219 / 287 |
7,474,255 | 52.29 | Government | ||
| 1978 | 7th Assembly | Marri Chenna Reddy | 290 | 175 / 294 |
7,908,220 | 39.25 | Government | ||
| 1983 | 8th Assembly | Kotla Vijaya Bhaskara Reddy | 294 | 60 / 294 |
7,090,907 | 33.64 | Opposition | ||
| 1985 | 9th Assembly | Kotla Vijaya Bhaskara Reddy | 290 | 50 / 294 |
8,566,891 | 37.25 | Opposition | ||
| 1989 | 10th Assembly | Marri Chenna Reddy | 287 | 181 / 294 |
13,539,785 | 47.09 | Government | ||
| 1994 | 11th Assembly | Kotla Vijaya Bhaskara Reddy | 294 | 26 / 294 |
10,540,182 | 33.85 | Opposition | ||
| 1999 | 12th Assembly | Y.S. Rajasekhara Reddy | 293 | 91 / 294 |
13,526,309 | 40.61 | Opposition | ||
| 2004 | 13th Assembly | Y.S. Rajasekhara Reddy | 294 | 185 / 294 |
13,793,461 | 38.56 | Government | ||
| 2009 | 14th Assembly | Y.S. Rajasekhara Reddy | 294 | 156 / 294 |
15,374,075 | 36.56 | Government | ||
| 2014 | 15th Assembly | Raghu Veera Reddy | 286 | 21 / 294 |
56,68,061 | 11.71 | Opposition | ||
| 2019 | 16th Assembly | Raghu Veera Reddy | 174 | 0 / 175 |
3,68,880 | 1.17 | Opposition |
General Elections
As Hyderabad State
| Year | General Election | Votes Polled | Seats Won | Seat Contested | Total Seats |
|---|---|---|---|---|---|
| 1951 | 1st Lok Sabha | 1,945,798 | 14 | - | - |
As Andhra Pradesh
| Year | General Election | Votes Polled | Seats Won | Seat Contested | Total Seats |
|---|---|---|---|---|---|
| 1957 | 2nd Lok Sabha | 4,906,074 | 37 | - | - |
| 1962 | 3rd Lok Sabha | 5,711,263 | 34 | - | 43 |
| 1967 | 4th Lok Sabha | 6,354,959 | 35 | - | 41 |
| 1971 | 5th Lok Sabha | 7,286,069 | 28 | - | 41 |
| 1977 | 6th Lok Sabha | 9,582,708 | 41 | - | 42 |
| 1980 | 7th Lok Sabha | 9,508,388 | 41 | - | 42 |
| 1984 | 8th Lok Sabha | 9,452,394 | 6 | - | 42 |
| 1989 | 9th Lok Sabha | 14,671,782 | 39 | - | 42 |
| 1991 | 10th Lok Sabha | 11,610,772 | 25 | - | 42 |
| 1996 | 11th Lok Sabha | 12,087,596 | 22 | - | 42 |
| 1998 | 12th Lok Sabha | 12,269,475 | 22 | - | 42 |
| 1999 | 13th Lok Sabha | 14,278,099 | 5 | - | 42 |
| 2004 | 14th Lok Sabha | 14,861,984 | 29 | - | 41 |
| 2009 | 15th Lok Sabha | 21,254,124 | 33 | - | 42 |
| 2014 | 16th Lok Sabha | 5,578,329 | 0 | - | 25 |
| 2019 | 17th Lok Sabha | 4,06,568 | 0 | 25 | 25 |
Arunachal Pradesh
Legislative Assembly Elections[1]
| Year | Legislature | Leader | Seats Contested | Seats won | Change in seats | Votes | Percentage of votes | Vote swing | Outcome |
|---|---|---|---|---|---|---|---|---|---|
| 1978 | 1st Assembly | Tasso Grayu | 1 | 0 / 30 |
- | 720 | 0.45 | - | Opposition |
| 1980 | 2nd Assembly | Gegong Apang | 28 | 13 / 30 |
72,734 | 42.58 | Government | ||
| 1984 | 3rd Assembly | Gegong Apang | 30 | 21 / 30 |
96,791 | 43.07 | Government | ||
| 1990 | 4th Assembly | Gegong Apang | 59 | 37 / 60 |
154,463 | 44.25 | Government | ||
| 1995 | 5th Assembly | Gegong Apang | 60 | 43 / 60 |
214,543 | 50.5 | Government | ||
| 1999 | 6th Assembly | Mukut Mithi | 60 | 53 / 60 |
213,097 | 51.78 | Government | ||
| 2004 | 7th Assembly | Gegong Apang | 60 | 34 / 60 |
204,102 | 44.41 | Government | ||
| 2009 | 8th Assembly | Dorjee Khandu | 60 | 42 / 60 |
879,288 | 50.38 | Government | ||
| 2014 | 9th Assembly | Nabam Tuki | 60 | 42 / 60 |
251,575 | 49.5 | Government | ||
| 2019 | 10th Assembly | Nabam Tuki | 60 | 4 / 60 |
1,04,536 | 16.86 | Opposition | ||
General Elections
| Year | General Election | Votes Polled | Seats Won | Seat Contested | Total Seats | ref |
|---|---|---|---|---|---|---|
| 1977 | 6th Lok Sabha | 20,909 | 1 | 2 | 2 | |
| 1980 | 7th Lok Sabha | 76,600 | 2 | 2 | 2 | |
| 1984 | 8th Lok Sabha | 98,131 | 2 | 2 | 2 | |
| 1989 | 9th Lok Sabha | 136,541 | 2 | 2 | 2 | |
| 1991 | 10th Lok Sabha | 179,824 | 2 | 2 | 2 | |
| 1996 | 11th Lok Sabha | 84,615 | 0 | 2 | 2 | |
| 1998 | 12th Lok Sabha | 78,564 | 0 | 2 | 2 | |
| 1999 | 13th Lok Sabha | 242,275 | 2 | 2 | 2 | |
| 2004 | 14th Lok Sabha | 38,341 | 0 | 2 | 2 | |
| 2009 | 15th Lok Sabha | 234,689 | 2 | 2 | 2 | |
| 2014 | 16th Lok Sabha | 246,084 | 1 | 2 | 2 | |
| 2019 | 17th Lok Sabha | 134,888 | 0 | 2 | 2 | [2] |
Assam
Assam Legislative Assembly election
| Year | Legislature | Party leader | Seats Contested | Seats won | Change in seats |
Votes | Percentage of votes | Vote swing | Outcome |
|---|---|---|---|---|---|---|---|---|---|
| 1952 | 1st Assembly | Bishnu Ram Medhi | 92 | 76 / 105 |
10,64,850 | 43.48 | Government | ||
| 1957 | 2nd Assembly | 101 | 71 / 108 |
13,21,367 | 52.35 | Government | |||
| 1962 | 3rd Assembly | Bimala Prasad Chaliha | 103 | 79 / 105 |
11,79,305 | 48.25 | Government | ||
| 1967 | 4th Assembly | 120 | 73 / 126 |
13,54,748 | 43.60 | Government | |||
| 1972 | 5th Assembly | Sarat Chandra Sinha | 114 | 95 / 126 |
19,76,209 | 53.20 | Government | ||
| 1978 | 6th Assembly | 126 | 26 / 126 |
12,20,189 | 23.62 | Opposition | |||
| 1983 | 7th Assembly | Hiteswar Saikia | 109 | 91 / 109 |
11,94,657 | 52.53 | Government | ||
| 1985 | 8th Assembly | 125 | 26 / 126 |
17,24,003 | 23.23 | Opposition | |||
| 1991 | 9th Assembly | 125 | 66 / 126 |
24,55,302 | 29.35 | Government | |||
| 1996 | 10th Assembly | Bhumidhar Barman | 122 | 34 / 122 |
27,78,627 | 30.56 | Opposition | ||
| 2001 | 11th Assembly | Tarun Gogoi | 126 | 71 / 126 |
42,30,676 | 39.75 | Government | ||
| 2006 | 12th Assembly | 120 | 53 / 126 |
41,02,479 | 31.08 | Government | |||
| 2011 | 13th Assembly | 126 | 78 / 126 |
54,43,781 | 39.39 | Government | |||
| 2016 | 14th Assembly | 122 | 26 / 126 |
52,38,655 | 30.96 | Opposition | |||
| 2021 | 15th Assembly | Debabrata Saikia | 95 | 29 / 126 |
57,03,341 | 29.67 | Opposition | ||
General Elections
| Year | General Election | Votes Polled | Seats Won | Seat Contested | Total Seats | ref |
|---|---|---|---|---|---|---|
| 1951 | 1st Lok Sabha | 1,210,707 | 9 | - | 10 | |
| 1957 | 2nd Lok Sabha | 1,184,708 | 9 | - | 12 | |
| 1962 | 3rd Lok Sabha | 1,126,977 | 9 | - | 12 | |
| 1967 | 4th Lok Sabha | 1,369,715 | 10 | - | 14 | |
| 1971 | 5th Lok Sabha | 1,724,503 | 13 | - | 14 | |
| 1977 | 6th Lok Sabha | 1,932,994 | 10 | - | 14 | |
| 1980 | 7th Lok Sabha | 323,359 | 2 | - | 14 | |
| 1985 | 8th Lok Sabha | 1,749,688 | 4 | - | 14 | |
| 1989 | 9th Lok Sabha | - | - | - | ||
| 1991 | 10th Lok Sabha | 2,409,284 | 8 | - | 14 | |
| 1996 | 11th Lok Sabha | 2,981,700 | 5 | - | 14 | |
| 1998 | 12th Lok Sabha | 3,264,032 | 10 | - | 14 | |
| 1999 | 13th Lok Sabha | 3,808,472 | 10 | - | 14 | |
| 2004 | 14th Lok Sabha | 3,637,405 | 9 | 14 | 14 | |
| 2009 | 15th Lok Sabha | - | 7 | - | 14 | |
| 2014 | 16th Lok Sabha | - | 3 | - | 14 | |
| 2019 | 17th Lok Sabha | 63,73,659 | 3 | 14 | 14 | [3] |
Bihar
Legislative Assembly election
| Year | Legislature | Leader | Seats Contested | Seats won | Change in seats | Votes | Percentage of votes | Vote swing | Outcome |
|---|---|---|---|---|---|---|---|---|---|
| 1952 | 1st Assembly | Shri Krishna Sinha | 322 | 239 / 330 |
New | 39,51,145 | 41.38% | New | Government |
| 1957 | 2nd Assembly | 312 | 210 / 318 |
44,55,425 | 42.09% | Government | |||
| 1962 | 3rd Assembly | Binodanand Jha | 318 | 185 / 318 |
40,75,844 | 41.35% | Government | ||
| 1967 | 4th Assembly | K. B. Sahay | 318 | 128 / 318 |
44,79,460 | 33.09% | Opposition | ||
| 1969 | 5th Assembly | Harihar Singh | 318 | 118 / 318 |
45,70,413 | 30.46% | Government | ||
| 1972 | 6th Assembly | Kedar Pandey | 259 | 167 / 318 |
56,88,002 | 33.12% | Government | ||
| 1977 | 7th Assembly | Jagannath Mishra | 286 | 57 / 324 |
41,01,522 | 23.58% | Opposition | ||
| 1980 | 8th Assembly | 311 | 169 / 324 |
76,90,225 | 34.2% | Government | |||
| 1985 | 9th Assembly | Bindeshwari Dubey | 323 | 196 / 324 |
95,58,562 | 39.3% | Government | ||
| 1990 | 10th Assembly | Jagannath Mishra | 323 | 71 / 324 |
79,46,635 | 24.78% | Opposition | ||
| 1995 | 11th Assembly | 320 | 29 / 324 |
56,22,952 | 16.27% | Opposition | |||
| 2000 | 12th Assembly | Shakeel Ahmad | 324 | 23 / 324 |
40,96,467 | 11.06% | Opposition | ||
| 2005 | 13th Assembly | Ramjatan Sinha | 51 | 10 / 243 |
14,35,449 | 5.00% | Opposition | ||
| 2005 | 14th Assembly | Sadanand Singh | 84 | 9 / 243 |
12,28,835 | 6.09% | Opposition | ||
| 2010 | 15th Assembly | Mehboob Ali Kaiser | 243 | 4 / 243 |
24,31,477 | 8.37% | Opposition | ||
| 2015 | 16th Assembly | Ashok Choudhary | 41 | 27 / 243 |
25,39,638 | 6.66% | Government, later Opposition | ||
| 2020 | 17th Assembly | Madan Mohan Jha | 70 | 19 / 243 |
39,95,319 | 9.48% | Opposition, later Government |
General Elections
| Year | General Election | Votes Polled | Seats Won | Seat Contested | Total Seats | ref |
|---|---|---|---|---|---|---|
| 1951 | 1st Lok Sabha | 4,573,058 | 45 | - | - | |
| 1957 | 2nd Lok Sabha | 4,450,208 | 41 | - | - | |
| 1962 | 3rd Lok Sabha | 4,365,148 | 39 | - | - | |
| 1967 | 4th Lok Sabha | 4,749,813 | 34 | - | - | |
| 1971 | 5th Lok Sabha | 5,967,512 | 39 | - | - | |
| 1977 | 6th Lok Sabha | 4,781,142 | 0 | - | - | |
| 1980 | 7th Lok Sabha | 7,377,583 | 30 | - | - | |
| 1984 | 8th Lok Sabha | 12,970,432 | 48 | - | - | |
| 1989 | 9th Lok Sabha | 8,659,832 | 4 | - | - | |
| 1991 | 10th Lok Sabha | 7,007,304 | 1 | - | - | |
| 1996 | 11th Lok Sabha | 4,446,053 | 2 | - | - | |
| 1998 | 12th Lok Sabha | 2,717,204 | 4 | - | 54 | |
| 1999 | 13th Lok Sabha | 3,142,603 | 4 | - | 54 | |
| 2004 | 14th Lok Sabha | 1,315,935 | 3 | - | 40 | |
| 2009 | 15th Lok Sabha | 2,550,785 | 2 | - | 40 | |
| 2014 | 16th Lok Sabha | - | 2 | - | 40 | |
| 2019 | 17th Lok Sabha | 31,40,797 | 1 | 8 | 40 | [4] |
Chandigarh
General Election
| Year | General Election | Votes Polled | Seats Won | Seat Contested | Total Seats |
|---|---|---|---|---|---|
| 1967 | 4th Lok Sabha | 11,323 | 0 | 1 | 1 |
| 1971 | 5th Lok Sabha | 48,335 | 1 | 1 | 1 |
| 1977 | 6th Lok Sabha | 30,382 | 0 | 1 | 1 |
| 1980 | 7th Lok Sabha | 61,624 | 1 | 1 | 1 |
| 1984 | 8th Lok Sabha | 103,090 | 1 | 1 | 1 |
| 1989 | 9th Lok Sabha | 87,238 | 0 | 1 | 1 |
| 1991 | 10th Lok Sabha | 76,628 | 1 | 1 | 1 |
| 1996 | 11th Lok Sabha | 77,168 | 0 | 1 | 1 |
| 1998 | 12th Lok Sabha | 1,09,421 | 0 | 1 | 1 |
| 1999 | 13th Lok Sabha | 1,32,924 | 1 | 1 | 1 |
| 2004 | 14th Lok Sabha | 1,39,880 | 1 | 1 | 1 |
| 2009 | 14th Lok Sabha | 1,61,042 | 1 | 1 | 1 |
| 2014 | 16th Lok Sabha | 1,21,720 | 0 | 1 | 1 |
| 2019 | 17th Lok Sabha | 1,84,218 | 0 | 1 | 1 |
Chhattisgarh
Legislative Assembly Elections
| Year | Assembly Election | Votes Polled | Vote Percent | Seat Contested | Seats Won | Seat Change | Outcome |
|---|---|---|---|---|---|---|---|
| 2000 | 1st Assembly | Constituted on the basis of the M.P. Assembly Elections 1998 | N.A. | 90 | 48 / 90 | Government | |
| 2003 | 2nd Assembly | 3,543,754 | 36.71 | 90 | 37 / 90 | Opposition | |
| 2008 | 3rd Assembly | 4,146,853 | 38.62 | 87 | 38 / 90 | Opposition | |
| 2013 | 4th Assembly | 5,267,698 | 40.3 | 90 | 39 / 90 | Opposition | |
| 2018 | 5th Assembly | 6,136,429 | 43.0 | 90 | 68 / 90 | Government | |
| 2023 | 6th Assembly | 6,602,586 | 42.23 | 90 | 35 / 90 | Opposition |
General Elections
| Year | General Election | Votes Polled | Seats Won | Seat Contested | Total Seats |
|---|---|---|---|---|---|
| 2004 | 14th Lok Sabha | 2,869,260 | 1 | 11 | 11 |
| 2009 | 15th Lok Sabha | - | 1 | 11 | 11 |
| 2014 | 16th Lok Sabha | - | 1 | 11 | 11 |
| 2019 | 17th Lok Sabha | 5,569,283 | 2 | 11 | 11 |
Dadra and Nagar Haveli
General Elections
| Year | General Election | Votes Polled | Seats Won | Seat Contested | Total Seats |
|---|---|---|---|---|---|
| 1967 | 4th Lok Sabha | 10,654 | 1 | 1 | 1 |
| 1971 | 5th Lok Sabha | 8,484 | 1 | 1 | 1 |
| 1977 | 6th Lok Sabha | 11,324 | 1 | 1 | 1 |
| 1980 | 7th Lok Sabha | 19,277 | 1 | 1 | 1 |
| 1984 | 8th Lok Sabha | 15,471 | 0 | 1 | 1 |
| 1989 | 9th Lok Sabha | 14,875 | 0 | 1 | 1 |
| 1991 | 10th Lok Sabha | 29,907 | 1 | 1 | 1 |
| 1996 | 11th Lok Sabha | 39,384 | 1 | 1 | 1 |
| 1998 | 12th Lok Sabha | 2,997 | 0 | 1 | 1 |
| 1999 | 13th Lok Sabha | 10,601 | 0 | 1 | 1 |
| 2004 | 14th Lok Sabha | 21,772 | 0 | 1 | 1 |
| 2009 | 15th Lok Sabha | 50,624 | 0 | 1 | 1 |
| 2014 | 16th Lok Sabha | 74,576 | 0 | 1 | 1 |
| 2019 | 17th Lok Sabha | 8,608 | 0 | 1 | 1 |
Daman and Diu
General Elections
| Year | General Election | Votes Polled | Seats Won | Seat Contested | Total Seats |
|---|---|---|---|---|---|
| 1989 | 9th Lok Sabha | 13,807 | 0 | 1 | 1 |
| 1991 | 10th Lok Sabha | 8,623 | 0 | 1 | 1 |
| 1996 | 11th Lok Sabha | 24,543 | 1 | 1 | 1 |
| 1998 | 12th Lok Sabha | 1,020 | 0 | 1 | 1 |
| 1999 | 13th Lok Sabha | 25,136 | 1 | 1 | 1 |
| 2004 | 14th Lok Sabha | 27,523 | 1 | 1 | 1 |
| 2009 | 15th Lok Sabha | 19,708 | 0 | 1 | 1 |
| 2014 | 16th Lok Sabha | 37,738 | 0 | 1 | 1 |
| 2019 | 17th Lok Sabha | 27,655 | 0 | 1 | 1 |
Delhi
Legislative Assembly Elections
| Year | Assembly Election | Votes Polled | Seats Won | Seat Contested | Total Seats |
|---|---|---|---|---|---|
| 1952 | 1st Assembly | 271,812 | 39 | 47 | 48 |
| 1993 | 2nd Assembly | 1,224,361 | 14 | 70 | 70 |
| 1998 | 3rd Assembly | 1,952,071 | 52 | 70 | 70 |
| 2003 | 4th Assembly | 2,172,062 | 47 | 70 | 70 |
| 2008 | 5th Assembly | - | 43 | 70 | 70 |
| 2013 | 6th Assembly | 1,932,933 | 8 | 70 | 70 |
| 2015 | 7th Assembly | 867,027 | 0 | 70 | 70 |
General Elections
| Year | General Election | Votes Polled | Seats Won | Seat Contested | Total Seats |
|---|---|---|---|---|---|
| 1951 | 1st Lok Sabha | 324,214 | 3 | 5 | 5 |
| 1957 | 2nd Lok Sabha | 440,775 | 5 | 5 | 5 |
| 1962 | 3rd Lok Sabha | 453,174 | 5 | 5 | 5 |
| 1967 | 4th Lok Sabha | 434,937 | 1 | - | 7 |
| 1971 | 5th Lok Sabha | 835,673 | 7 | 7 | 7 |
| 1977 | 6th Lok Sabha | 542,145 | 0 | - | 7 |
| 1980 | 7th Lok Sabha | 990,004 | 6 | 7 | 7 |
| 1984 | 8th Lok Sabha | 1,528,252 | 7 | 7 | 7 |
| 1989 | 9th Lok Sabha | 1,322,876 | 2 | - | 7 |
| 1991 | 10th Lok Sabha | 1,152,627 | 2 | - | 7 |
| 1996 | 11th Lok Sabha | 1,499,128 | 2 | 7 | 7 |
| 1998 | 12th Lok Sabha | 1,798,165 | 1 | 7 | 7 |
| 1999 | 13th Lok Sabha | 1,591,682 | 0 | 7 | 7 |
| 2004 | 14th Lok Sabha | 2,261,199 | 6 | 7 | 7 |
| 2009 | 15th Lok Sabha | - | 7 | 7 | 7 |
| 2014 | 16th Lok Sabha | - | 0 | 7 | 7 |
| 2019 | 17th Lok Sabha | 1,953,900 | 0 | 7 | 7 |
Goa
Legislative Assembly Elections
As Goa, Daman and Diu
| Year | General Election | Votes Polled | Seats Won | Seat Contested | Total Seats |
|---|---|---|---|---|---|
| 1967 | 1st Assembly | Didn't Contest | - | - | 30 |
| 1972 | 2nd Assembly | 41,612 | 1 | 19 | 30 |
| 1977 | 3rd Assembly | 87,461 | 10 | 27 | 30 |
| 1980 | 4th Assembly | 12,338 | 0 | - | 30 |
| 1984 | 5th Assembly | 160,944 | 18 | - | 30 |
As Goa
| Year | General Election | Votes Polled | Seats Won | Seat Contested | Total Seats |
|---|---|---|---|---|---|
| 1989 | 1st Assembly | 204,321 | 20 | - | 40 |
| 1994 | 2nd Assembly | 216,165 | 18 | - | 40 |
| 1999 | 3rd Assembly | 222,747 | 21 | - | 40 |
| 2002 | 4th Assembly | 244,478 | 16 | - | 40 |
| 2007 | 5th Assembly | - | 16 | 32 | 40 |
| 2012 | 6th Assembly | - | 9 | 34 | 40 |
| 2017 | 7th Assembly | 259,758 | 17 | - | 40 |
General Elections
As Goa, Daman and Diu
| Year | General Election | Votes Polled | Seats Won | Seat Contested | Total Seats |
|---|---|---|---|---|---|
| 1967 | 4th Lok Sabha | 15,205 | 0 | 2 | 2 |
| 1971 | 5th Lok Sabha | 57,627 | 1 | 2 | 2 |
| 1977 | 6th Lok Sabha | 117,150 | 1 | 2 | 2 |
| 1980 | 7th Lok Sabha | 43,030 | 0 | 2 | 2 |
| 1984 | 8th Lok Sabha | 188,779 | 2 | 2 | 2 |
As Goa
| Year | General Election | Votes Polled | Seats Won | Seat Contested | Total Seats |
|---|---|---|---|---|---|
| 1989 | 9th Lok Sabha | 198,100 | 1 | 2 | 2 |
| 1991 | 10th Lok Sabha | 181,434 | 1 | 2 | 2 |
| 1996 | 11th Lok Sabha | 165,857 | 0 | 2 | 2 |
| 1998 | 12th Lok Sabha | 168,314 | 2 | 2 | 2 |
| 1999 | 13th Lok Sabha | 159,844 | 0 | 2 | 2 |
| 2004 | 14th Lok Sabha | 164,432 | 1 | 2 | 2 |
| 2009 | 15th Lok Sabha | - | 1 | 2 | 2 |
| 2014 | 16th Lok Sabha | - | 0 | 2 | 2 |
| 2019 | 17th Lok Sabha | 3,66,158 | 1 | 2 | 2 |
Gujarat
Legislative Assembly Elections
| Year | Assembly Election | Votes Polled | Vote Percent | Seat Contested | Seats Won | Seat Change | Outcome |
|---|---|---|---|---|---|---|---|
| 1960 | 1st Assembly | Constituted out of Bombay assembly (Polls held in 1957) | N.A. | N.A. | N.A. | N.A. | Government |
| 1962 | 2nd Assembly | 2,646,286 | 50.84% | N.A. | 113 / 154 | N.A. | Government |
| 1967 | 3rd Assembly | 2,933,059 | 45.96% | N.A. | 93 / 168 | Government, later Opposition | |
| 1972 | 4th Assembly | 3,527,035 | 50.93 | N.A. | 140 / 168 | Government | |
| 1975 | 5th Assembly | 3,280,514 | 40.70 | N.A. | 75 / 182 | Opposition, briefly back in govt and later in oppn again | |
| 1980 | 6th Assembly | 3,971,238 | 51.04% | N.A. | 141 / 182 | Government | |
| 1985 | 7th Assembly | 5,122,753 | 55.55% | N.A. | 149 / 182 | Government | |
| 1990 | 8th Assembly | 3,899,159 | 30.74% | N.A. | 33 / 182 | Opposition, later Government | |
| 1995 | 9th Assembly | 5,930,216 | 32.86% | N.A. | 45 / 182 | Opposition, later Government | |
| 1998 | 10th Assembly | 5,677,386 | 34.85% | N.A. | 53 / 182 | Opposition | |
| 2002 | 11th Assembly | 8,033,104 | 39.28% | N.A. | 51 / 182 | Opposition | |
| 2007 | 12th Assembly | 8,309,450 | 38.00% | N.A. | 59 / 182 | Opposition | |
| 2012 | 13th Assembly | 10,674,767 | 38.93% | N.A. | 61 / 182 | Opposition | |
| 2017 | 14th Assembly | 12,438,937 | 41.4% | N.A. | 77 / 182 | Opposition | |
| 2022 | 15th Assembly | 8,683,966 | 27.28% | 179 | 17 / 182 | Opposition |
Haryana
Legislative Assembly Elections
| Year | Assembly Election | Votes Polled | Seats Won | Seat Contested | Total Seats |
|---|---|---|---|---|---|
| 1966 | 1st Assembly | Constituted out of Punjab assembly | |||
| 1967 | 2st Assembly | 1,252,290 | 48 | 81 | |
| 1968 | 3nd Assembly | 1,114,176 | 48 | 81 | |
| 1972 | 4th Assembly | 1,639,405 | 52 | 81 | |
| 1977 | 5th Assembly | 648,422 | 3 | 90 | |
| 1982 | 6th Assembly | 1,845,297 | 36 | 90 | |
| 1987 | 7th Assembly | 1,776,820 | 5 | 90 | |
| 1991 | 8th Assembly | 2,084,856 | 51 | 90 | 90 |
| 1996 | 9th Assembly | 1,576,882 | 9 | 90 | |
| 2000 | 10th Assembly | 2,388,950 | 21 | 90 | 90 |
| 2005 | 11th Assembly | 3,889,125 | 67 | 90 | 90 |
| 2009 | 12th Assembly | - | 40 | 90 | 90 |
| 2014 | 13th Assembly | - | 15 | 90 |
General Elections
| Year | General Election | Votes Polled | Seats Won | Seat Contested | Total Seats |
|---|---|---|---|---|---|
| 1967 | 4th Lok Sabha | 1,344,830 | 7 | 9 | |
| 1971 | 5th Lok Sabha | 1,572,929 | 7 | 9 | |
| 1977 | 6th Lok Sabha | 744,862 | 0 | 10 | |
| 1980 | 7th Lok Sabha | 1,426,261 | 5 | 10 | |
| 1984 | 8th Lok Sabha | 2,787,655 | 10 | 10 | 10 |
| 1989 | 9th Lok Sabha | 2,816,831 | 4 | 10 | |
| 1991 | 10th Lok Sabha | 2,310,003 | 9 | 10 | |
| 1996 | 11th Lok Sabha | 1,723,087 | 2 | 10 | |
| 1998 | 12th Lok Sabha | 1,965,397 | 3 | 10 | |
| 1999 | 13th Lok Sabha | 2,435,752 | 0 | 10 | |
| 2004 | 14th Lok Sabha | 3,409,950 | 9 | 10 | 10 |
| 2009 | 15th Lok Sabha | - | 9 | 10 | 10 |
| 2014 | 16th Lok Sabha | 2,634,905 | 1 | 10 | 10 |
| 2019 | 17th Lok Sabha | 36,04,106 | 0 | 10 | 10 |
Himachal Pradesh
Legislative Assembly Elections
| Year | Assembly Election | Votes Polled | Seats Won | Seat Change | Outcome |
|---|---|---|---|---|---|
| 1952 | 1st Assembly | 84,819 | 24 / 36 |
New | Government |
| 1967 | 2nd Assembly | 323,247 | 34 / 60 |
Government | |
| 1972 | 3rd Assembly | 467,592 | 53 / 68 |
Government | |
| 1977 | 4th Assembly | 314,780 | 9 / 68 |
Opposition | |
| 1982 | 5th Assembly | 659,239 | 31 / 68 |
Government | |
| 1985 | 6th Assembly | 910,053 | 58 / 68 |
Government | |
| 1990 | 7th Assembly | 750,885 | 9 / 68 |
Opposition | |
| 1993 | 8th Assembly | 1,135,203 | 52 / 68 |
Government | |
| 1998 | 9th Assembly | 1,110,055 | 31 / 68 |
Opposition | |
| 2003 | 10th Assembly | 1,251,414 | 43 / 68 |
Government | |
| 2007 | 11th Assembly | 1,252,955 | 23 / 68 |
Opposition | |
| 2012 | 12th Assembly | 1,447,319 | 36 / 68 |
Government | |
| 2017 | 13th Assembly | 1,577,450 | 21 / 68 |
Opposition | |
| 2022 | 14th Assembly | 1,852,504 | 40 / 68 |
Government |
General Elections
| Year | General Election | Votes Polled | Seats Won | Seat Change | Outcome |
|---|---|---|---|---|---|
| 1951 | 1st Lok Sabha | 117,036 | 3 | Government | |
| 1957 | 2nd Lok Sabha | 171,591 | 4 | Government | |
| 1962 | 3rd Lok Sabha | 166,749 | 4 | Government | |
| 1967 | 4th Lok Sabha | 375,578 | 6 | Government (1967–69),Coalition (1969–71) | |
| 1971 | 5th Lok Sabha | 516,959 | 4 | Government | |
| 1977 | 6th Lok Sabha | 439,398 | 0 | Opposition | |
| 1980 | 7th Lok Sabha | 653,018 | 4 | Government | |
| 1984 | 8th Lok Sabha | 942,657 | 4 | Government | |
| 1989 | 9th Lok Sabha | 789,804 | 1 | Opposition | |
| 1991 | 10th Lok Sabha | 808,659 | 2 | Government | |
| 1996 | 11th Lok Sabha | 1,097,007 | 4 | Opposition, later outside support for UF | |
| 1998 | 12th Lok Sabha | 997,410 | 1 | Opposition | |
| 1999 | 13th Lok Sabha | 843,225 | 0 | Opposition | |
| 2004 | 14th Lok Sabha | 1,294,988 | 3 | Coalition | |
| 2009 | 15th Lok Sabha | 1,226,933 | 1 | Coalition | |
| 2014 | 16th Lok Sabha | 1,260,477 | 0 | Opposition | |
| 2019 | 17th Lok Sabha | 10,51,113 | 0 | Opposition |
Jammu and Kashmir
Legislative Assembly Elections
As Jammu Kashmir State
| Year | Legislative Election | Votes Polled | Seats Won | Seat Contested | Total Seats |
|---|---|---|---|---|---|
| 1957 | Constituent Assembly | ||||
| 1957 | 1st Assembly | Didn't Contest | 75 | ||
| 1962 | 2nd Assembly | Didn't Contest | 75 | ||
| 1967 | 3rd Assembly | 423,922 | 61 | 75 | |
| 1972 | 4th Assembly | 764,492 | 58 | 75 | |
| 1977 | 5th Assembly | 294,911 | 11 | 76 | |
| 1983 | 6th Assembly | 666,112 | 26 | 76 | |
| 1987 | 7th Assembly | 525,261 | 26 | 76 | |
| 1996 | 8th Assembly | 496,628 | 7 | 87 | |
| 2002 | 9th Assembly | 643,751 | 20 | 87 | |
| 2008 | 10th Assembly | - | 17 | 87 | |
| 2014 | 11th Assembly | 867,883 | 12 | 87 |
General Elections
| Year | General Election | Votes Polled | Seats Won | Seat Contested | Total Seats |
|---|---|---|---|---|---|
| 1967 | 4th Lok Sabha | 425,668 | 5 | 6 | |
| 1971 | 5th Lok Sabha | 630,690 | 5 | 6 | |
| 1977 | 6th Lok Sabha | 233,144 | 3 | 6 | |
| 1980 | 7th Lok Sabha | 249,760 | 1 | 6 | |
| 1984 | 8th Lok Sabha | 661,435 | 3 | 6 | |
| 1989 | 9th Lok Sabha | 407,474 | 2 | 6 | |
| 1989 | 9th Lok Sabha | No Elections | |||
| 1996 | 11th Lok Sabha | 569,942 | 4 | 6 | |
| 1998 | 12th Lok Sabha | 415,354 | 1 | 6 | |
| 1999 | 13th Lok Sabha | 280,065 | 0 | 6 | |
| 2004 | 14th Lok Sabha | 623,182 | 2 | 6 | |
| 2009 | 15th Lok Sabha | - | 2 | 6 | |
| 2014 | 16th Lok Sabha | - | 0 | 6 | |
| 2019 | 17th Lok Sabha | 10,11,527 | 0 | 5 | 6 |
As Jammu and Kashmir Union Territory
Ladakh
Jharkhand
Legislative Assembly Elections
| Year | General Election | Votes Polled | Seats Won | Seat Contested | Total Seats |
|---|---|---|---|---|---|
| 2000 | 1st Assembly | Constituted on the Basis of the Bihar Legislative Assembly Elections 2000. | 81 | ||
| 2005 | 2st Assembly | 1,220,498 | 9 | 41 | 81 |
| 2009 | 3rd Assembly | 1,660,977 | 14 | - | 81 |
| 2014 | 4th Assembly | 1,450,640 | 6 | - | 81 |
| 2019 | 5th Assembly | 2,088,863 | 16 | 31 | 81 |
General Elections
| Year | General Election | Votes Polled | Seats Won | Seat Contested | Total Seats |
|---|---|---|---|---|---|
| 2004 | 14th Lok Sabha | 2,007,334 | 6 | - | 14 |
| 2009 | 15th Lok Sabha | - | 1 | - | 14 |
| 2014 | 16th Lok Sabha | - | 0 | - | 14 |
| 2019 | 17th Lok Sabha | 23,38,538 | 1 | 9 | 14 |
Karnataka
Legislative Assembly Elections
As Mysore
| Year | General Election | Votes Polled | Vote Percent | Seat Contested | Seats Won | Seat Change | Outcome |
|---|---|---|---|---|---|---|---|
| 1951 | 1st Assembly | 1,276,318 | N.A. | 99 | 74 / 99 | Government | |
| 1957 | 2nd Assembly | 3,343,839 | N.A. | 207 | 150 / 208 | Government | |
| 1962 | 3rd Assembly | 3,164,811 | N.A. | N.A. | 138 / 208 | Government | |
| 1967 | 4th Assembly | 3,636,374 | N.A. | N.A. | 126 / 216 | Government | |
| 1972 | 5th Assembly | 4,698,824 | N.A. | N.A. | 165 / 216 | Government |
As Karnataka
| Year | General Election | Votes Polled | Vote Percent | Seat Contested | Seats Won | Seat Change | Outcome | |
|---|---|---|---|---|---|---|---|---|
| 1978 | 6th Assembly | 5,543,756 | 44.25% | 214 | 149 / 224 | Government | ||
| 1983 | 7th Assembly | 5,221,419 | 40.42% ( | 221 | 82 / 224 | Opposition | ||
| 1985 | 8th Assembly | 6,009,461 | 40.82% ( | 223 | 65 / 224 | Opposition | ||
| 1989 | 9th Assembly | 7,990,142 | 43.76% ( | 221 | 178 / 224 | Government | ||
| 1994 | 10th Assembly | 5,580,473 | 29.95% ( | 221 | 34 / 224 | Opposition | ||
| 1999 | 11th Assembly | 9,077,815 | 40.84%( | 222 | 132 / 224 | Government | ||
| 2004 | 12th Assembly | 8,861,959 | 35.27% ( | 224 | 65 / 224 | 2 Years Coalition Government with JDS | ||
| 2008 | 13th Assembly | N.A. | 35.13% ( | N.A. | 80 / 224 | Opposition | ||
| 2013 | 14th Assembly | 11,473,025 | 36.6% ( | 223 | 122 / 224 | Government | ||
| 2018 | 15th Assembly | 13,986,526 | 38.14% ( | N.A. | 80 / 224 | Coalition Government With JDS | ||
| 2023 | 16th Assembly | 16,789,272 | 42.88% ( |
223 | 135 / 224 |
|
|| style="background:#bfd; color:black; vertical-align:middle; text-align:center; " class="table-yes2" |Government |
General Elections
As Mysore
| Year | General Election | Votes Polled | Seats Won | Seat Contested | Total Seats |
|---|---|---|---|---|---|
| 1951 | 1st Lok Sabha | 1,509,075 | 10 | - | 11 |
| 1957 | 2nd Lok Sabha | 3,219,014 | 23 | - | 26 |
| 1962 | 3rd Lok Sabha | 3,381,276 | 25 | - | 26 |
| 1967 | 4th Lok Sabha | 3,755,339 | 18 | - | 27 |
| 1971 | 5th Lok Sabha | 5,418,541 | 27 | 27 | 27 |
As Karnataka
| Year | General Election | Votes Polled | Seats Won | Seat Contested | Total Seats |
|---|---|---|---|---|---|
| 1977 | 6th Lok Sabha | 5,833,567 | 26 | - | 28 |
| 1980 | 7th Lok Sabha | 6,154,746 | 27 | - | 28 |
| 1984 | 8th Lok Sabha | 6,974,044 | 24 | - | 28 |
| 1989 | 9th Lok Sabha | 9,008,980 | 27 | 28 | 28 |
| 1991 | 10th Lok Sabha | 6,490,020 | 23 | - | 28 |
| 1996 | 11th Lok Sabha | 5,668,988 | 5 | - | 28 |
| 1998 | 12th Lok Sabha | 7,642,756 | 9 | - | 28 |
| 1999 | 13th Lok Sabha | 10,150,765 | 18 | - | 28 |
| 2004 | 14th Lok Sabha | 9,247,605 | 8 | - | 28 |
| 2009 | 15th Lok Sabha | N.A. | 6 | - | 28 |
| 2014 | 16th Lok Sabha | N.A. | 9 | - | 28 |
| 2019 | 17th Lok Sabha | 1,12,03,016 | 1 | 20 | 28 |
Kerala
Legislative Assembly Elections
As Travancore-Cochin
| Year | General Election | Votes Polled | Seats Won | Seat Contested | Total Seats |
|---|---|---|---|---|---|
| 1951 | 1st Assembly | 1,204,364 | 44 | 105 | 108 |
| 1954 | 2nd Assembly | 1,762,820 | 45 | 115 | 117 |
As Kerala
| Year | General Election | Votes Polled | Seats | Seat Contested | Seat Change | Result |
|---|---|---|---|---|---|---|
| 1957 | 1st Assembly | 2,209,251 | 43 / 126 | 124 | -- | Opposition |
| 1960 | 2nd Assembly | 2,789,556 | 63 / 126 | 80 | Government | |
| 1965 | 3rd Assembly | 2,123,660 | 36 / 133 | 133 | Hung Assembly | |
| 1967 | 3rd Assembly | 2,225,026 | 9 / 133 | 133 | Opposition | |
| 1970 | 4th Assembly | 1,327,270 | 30 / 133 | - | Government | |
| 1977 | 5th Assembly | 1,755,882 | 38 / 140 | - | Government | |
| 1980 | 6th Assembly | 1,624,446 | 17 / 140 | - | Opposition | |
| 1982 | 7th Assembly | 1,137,632 | 20 / 140 | 36 | Government | |
| 1987 | 8th Assembly | 3,164,409 | 33 / 140 | 76 | Opposition | |
| 1991 | 9th Assembly | 4,546,379 | 55 / 140 | 91 | Government | |
| 1996 | 10th Assembly | 4,340,717 | 37 / 140 | 94 | Opposition | |
| 2001 | 11th Assembly | 4,940,883 | 63 / 140 | 88 | Government | |
| 2006 | 12th Assembly | 3,744,784 | 24 / 140 | - | Opposition | |
| 2011 | 13th Assembly | 4,667,520 | 38 / 140 | 82 | Government | |
| 2016 | 14th Assembly | 4,794,793 | 22 / 140 | 87 | Opposition | |
| 2021 | 15th Assembly | 5,233,429 | 21 / 140 | 93 | Opposition |
General Elections
As Travancore-Cochin
| Year | General Election | Votes Polled | Seats Won | Seat Contested | Total Seats |
|---|---|---|---|---|---|
| 1951 | 1st Lok Sabha | 1,224,533 | 6 |
Kerala
| Year | General Election | Votes Polled | Seats Won | Seat Contested | Total Seats |
|---|---|---|---|---|---|
| 1957 | 2nd Lok Sabha | 2,102,883 | 6 | ||
| 1962 | 3rd Lok Sabha | 1,895,226 | 6 | ||
| 1967 | 4th Lok Sabha | 2,267,393 | 1 | ||
| 1971 | 5th Lok Sabha | 1,289,601 | 6 | ||
| 1977 | 6th Lok Sabha | 2,579,745 | 11 | ||
| 1980 | 7th Lok Sabha | 2,150,186 | 5 | ||
| 1984 | 8th Lok Sabha | 3,624,315 | 13 | ||
| 1989 | 9th Lok Sabha | 6,218,850 | 14 | ||
| 1991 | 10th Lok Sabha | 5,526,187 | 13 | ||
| 1996 | 11th Lok Sabha | 5,467,132 | 7 | ||
| 1998 | 12th Lok Sabha | 5,746,566 | 8 | ||
| 1999 | 13th Lok Sabha | 6,051,905 | 8 | ||
| 2004 | 14th Lok Sabha | 4,846,637 | 0 | 17 | 20 |
| 2009 | 15th Lok Sabha | 6,434,486 | 13 | - | 20 |
| 2014 | 16th Lok Sabha | 5,590,285 | 8 | 15 | 20 |
| 2019 | 17th Lok Sabha | 7,596,610 | 15 | 16 | 20 |
Lakshadweep
General Election
| Year | General Election | Votes Polled | Seats Won | Seat Contested | Total Seats |
|---|---|---|---|---|---|
| 1967 | 4th Lok Sabha | Didn't Contest | |||
| 1971 | 5th Lok Sabha | Candidate Elected Unopposed | 1 | 1 | 1 |
| 1977 | 6th Lok Sabha | 9,600 | 1 | 1 | 1 |
| 1980 | 7th Lok Sabha | 685 | 0 | 1 | 1 |
| 1984 | 8th Lok Sabha | 10,361 | 1 | 1 | 1 |
| 1989 | 9th Lok Sabha | 13,323 | 1 | 1 | 1 |
| 1991 | 10th Lok Sabha | 12,801 | 1 | 1 | 1 |
| 1996 | 11th Lok Sabha | 15,611 | 1 | 1 | 1 |
| 1998 | 12th Lok Sabha | 16,014 | 1 | 1 | 1 |
| 1999 | 13th Lok Sabha | 16,113 | 1 | 1 | 1 |
| 2004 | 14th Lok Sabha | 15,526 | 0 | 1 | 1 |
| 2009 | 15th Lok Sabha | 20,492 | 1 | 1 | 1 |
| 2014 | 16th Lok Sabha | 20,130 | 0 | 1 | 1 |
| 2019 | 17th Lok Sabha | 22,028 | 0 | 1 | 1 |
Madhya Pradesh
Legislative Assembly Elections
| Year | Assembly Election | Votes Polled | Seats Won | Seat Contested | Total Seats |
|---|---|---|---|---|---|
| 1951 | 1st Assembly | 3,434,058 | 194 | 225 | 232 |
| 1957 | 2nd Assembly | 3,691,999 | 232 | 288 | 288 |
| 1962 | 3rd Assembly | 2,527,257 | 142 | 288 | 288 |
| 1967 | 4th Assembly | 3,700,686 | 167 | 296 | 320 |
| 1972 | 5th Assembly | 5,219,823 | 220 | 289 | 320 |
| 1977 | 6th Assembly | 4,200,717 | 84 | 320 | 320 |
| 1980 | 7th Assembly | 5,741,077 | 246 | 320 | 320 |
| 1985 | 8th Assembly | 6,937,747 | 250 | 320 | 320 |
| 1990 | 9th Assembly | 6,634,518 | 56 | 318 | 320 |
| 1993 | 10th Assembly | 9,628,464 | 174 | 318 | 320 |
| 1998 | 11th Assembly | 10,778,985 | 172 | 316 | 320 |
| 2003 | 12th Assembly | 8,059,414 | 38 | 228 | 230 |
| 2008 | 13th Assembly | 8,170,318 | 71 | 228 | 230 |
| 2013 | 14th Assembly | 12,315,253 | 58 | 230 | 230 |
| 2018 | 15th Assembly | 15,595,696 | 114 | 229 | 230 |
| 2023 | 16th Assembly | 17,188,236 | 66 | 230 | 230 |
General Elections
| Year | General Election | Votes Polled | Seats Won | Seat Contested | Total Seats |
|---|---|---|---|---|---|
| 1951 | 1st Lok Sabha | 3,713,537 | 27 | - | 28 |
| 1957 | 2nd Lok Sabha | 3,967,199 | 34 | - | 35 |
| 1962 | 3rd Lok Sabha | 2,651,882 | 24 | - | 36 |
| 1967 | 4th Lok Sabha | 3,774,364 | 24 | - | 37 |
| 1971 | 5th Lok Sabha | 4,027,658 | 21 | - | 37 |
| 1977 | 6th Lok Sabha | 3,835,807 | 1 | - | 40 |
| 1980 | 7th Lok Sabha | 5,949,859 | 35 | - | 40 |
| 1984 | 8th Lok Sabha | 8,898,835 | 40 | 40 | 40 |
| 1989 | 9th Lok Sabha | 7,420,935 | 8 | - | 40 |
| 1991 | 10th Lok Sabha | 7,425,644 | 27 | - | 40 |
| 1996 | 11th Lok Sabha | 7,111,753 | 8 | - | 40 |
| 1998 | 12th Lok Sabha | 10,611,317 | 10 | - | 40 |
| 1999 | 13th Lok Sabha | 11,135,161 | 11 | - | 40 |
| 2004 | 14th Lok Sabha | 6,289,013 | 4 | - | 29 |
| 2009 | 15th Lok Sabha | - | 12 | - | 29 |
| 2014 | 16th Lok Sabha | - | 2 | 29 | 29 |
| 2019 | 17th Lok Sabha | 1,27,33,051 | 1 | 29 | 29 |
Maharashtra
Legislative Assembly
| Year | Assembly Election | Votes Polled | Vote Percent | Seat Contested | Seats Won | Seat Change | Outcome |
|---|---|---|---|---|---|---|---|
| 1960 | 1st Assembly Constituted out of Bombay assembly (Polls held in 1957) | 8,131,604 | 48.66% | 396 (264 Maharashtra Seats) | 234 of Total; 135 / 264 of Maharashtra Seats | Government | |
| 1962 | 2nd Assembly | 5,617,347 | 51.22% ( | 264 | 215 / 264 | Government | |
| 1967 | 3rd Assembly | 6,288,564 | 47.03% ( | 270 | 203 / 270 | Government | |
| 1972 | 4th Assembly | 8,535,832 | 56.36% ( | 271 | 222 / 270 | Government | |
| 1978 | 5th Assembly | 5,159,828 | 25.33% ( | 259 | 69 / 288 | Coalition Government With Rebel Congress | |
| 1980 | 6th Assembly | 7,809,533 | 44.50% ( | 286 | 186 / 288 | Government | |
| 1985 | 7th Assembly | 9,522,556 | 43.41% ( | 287 | 161 / 288 | Government | |
| 1990 | 8th Assembly | 11,334,773 | 38.17% ( | 276 | 141 / 288 | Government | |
| 1995 | 9th Assembly | 11,941,832 | 31% ( | 286 | 80 / 288 | Opposition | |
| 1999 | 10th Assembly | 8,937,043 | 27.2% ( | 249 | 75 / 288 | Coalition Government With NCP | |
| 2004 | 11th Assembly | 8,810,363 | 21.06% ( | 157 | 69 / 288 | Coalition Government With NCP | |
| 2009 | 12th Assembly | 9,521,703 | 21.01% ( | 170 | 82 / 288 | Coalition Government With NCP | |
| 2014 | 13th Assembly | 9,496,095 | 17.95% ( | 287 | 42 / 288 | Opposition | |
| 2019 | 14th Assembly | 8,752,199 | 15.87% ( | 147 | 44 / 288 | Coalition Government With SHS and NCP |
Manipur
Legislative Assembly
| Year | Assembly Election | Votes Polled | Seats Won | Seat Contested | Total Seats |
|---|---|---|---|---|---|
| 1967 | 1st Assembly | 101,504 | 16 | - | 30 |
| 1972 | 2nd Assembly | 135,678 | 17 | - | 60 |
| 1974 | 3rd Assembly | 164,717 | 13 | - | 60 |
| 1980 | 4th Assembly | 158,127 | 13 | - | 60 |
| 1984 | 5th Assembly | 257,809 | 30 | - | 60 |
| 1990 | 6th Assembly | 333,765 | 24 | - | 60 |
| 1995 | 7th Assembly | 328,362 | 22 | - | 60 |
| 2000 | 8th Assembly | 230,748 | 11 | - | 60 |
| 2002 | 9th Assembly | 345,660 | 20 | - | 60 |
| 2007 | 10th Assembly | 345,660 | 30 | - | 60 |
| 2012 | 11th Assembly | 592,566 | 42 | - | 60 |
| 2017 | 12th Assembly | 582,056 | 28 | - | 60 |
| 2022 | 13th Assembly | 312,659 | 5 | 53 | 60 |
General Assembly
| Year | General Election | Votes Polled | Seats Won | Seat Contested | Total Seats |
|---|---|---|---|---|---|
| 1951 | 1st Lok Sabha | 36,317 | 1 | - | 2 |
| 1957 | 2nd Lok Sabha | 48,687 | 1 | - | 2 |
| 1962 | 3rd Lok Sabha | 81,860 | 1 | - | 2 |
| 1967 | 4th Lok Sabha | 103,010 | 0 | - | 2 |
| 1971 | 5th Lok Sabha | 77,974 | 2 | 2 | 2 |
| 1977 | 6th Lok Sabha | 210,851 | 2 | 2 | 2 |
| 1980 | 7th Lok Sabha | 164,473 | 1 | - | 2 |
| 1984 | 8th Lok Sabha | 294,002 | 2 | 2 | 2 |
| 1989 | 9th Lok Sabha | 387,829 | 2 | - | 2 |
| 1991 | 10th Lok Sabha | 325,023 | 1 | - | 2 |
| 1996 | 11th Lok Sabha | 385,206 | 2 | 2 | 2 |
| 1998 | 12th Lok Sabha | 139,434 | 0 | - | 2 |
| 1999 | 13th Lok Sabha | 226,047 | 0 | - | 2 |
| 2004 | 14th Lok Sabha | 154,055 | 1 | 1 | 2 |
| 2009 | 15th Lok Sabha | - | 2 | 2 | 2 |
| 2014 | 16th Lok Sabha | - | 2 | 2 | 2 |
| 2019 | 17th Lok Sabha | 398,387 | 0 | 2 | 2 |
Meghalaya
Legislative Assembly
| Year | Assembly Election | Votes Polled | Seats Won | Seat Contested | Total Seats |
|---|---|---|---|---|---|
| 1972 | 1st Assembly | 20,474 | 9 | - | 60 |
| 1978 | 2nd Assembly | 109,654 | 20 | - | 60 |
| 1983 | 3rd Assembly | 130,956 | 25 | - | 60 |
| 1988 | 4th Assembly | 198,028 | 22 | - | 60 |
| 1993 | 5th Assembly | 282,139 | 24 | - | 60 |
| 1998 | 6th Assembly | 293,346 | 25 | - | 60 |
| 2003 | 7th Assembly | 270,269 | 22 | - | 60 |
| 2008 | 8th Assembly | 357,113 | 25 | 59 | 60 |
| 2009 | 9th Assembly | 458,783 | 29 | 60 | 60 |
| 2018 | 10th Assembly | 447,472 | 21 | 59 | 60 |
| 2023 | 11th Assembly | 243,841 | 5 | 60 | 60 |
General Elections
| Year | General Election | Votes Polled | Seats Won | Seat Contested | Total Seats |
|---|---|---|---|---|---|
| 1977 | 6th Lok Sabha | 91,255 | 1 | - | 2 |
| 1980 | 7th Lok Sabha | 82,307 | 1 | - | 2 |
| 1984 | 8th Lok Sabha | 249,266 | 2 | 2 | 2 |
| 1989 | 9th Lok Sabha | 264,210 | 2 | 2 | 2 |
| 1991 | 10th Lok Sabha | 281,562 | 2 | 2 | 2 |
| 1996 | 11th Lok Sabha | 353,327 | 1 | 2 | 2 |
| 1998 | 12th Lok Sabha | 399,583 | 2 | 2 | 2 |
| 1999 | 13th Lok Sabha | 214,324 | 1 | 2 | 2 |
| 2004 | 14th Lok Sabha | 309,233 | 1 | 2 | 2 |
| 2009 | 15th Lok Sabha | - | 1 | 1 | 2 |
| 2014 | 16th Lok Sabha | - | 1 | 1 | 2 |
| 2019 | 17th Lok Sabha | 6,60,114 | 1 | 2 | 2 |
Mizoram
Legislative Assembly
| Year | Assembly Election | Votes Polled | Seats Won | Seat Contested | Total Seats | Outcome |
|---|---|---|---|---|---|---|
| 1972 | 1st Assembly | 34,421 | 6 | 29 | 30 | Opposition |
| 1978 | 2nd Assembly | - | - | - | - | |
| 1979 | 3rd Assembly | 39,115 | 5 | 25 | 30 | Opposition |
| 1984 | 4th Assembly | 74,005 | 20 | 30 | 30 | Government |
| 1987 | 5th Assembly | 76,152 | 13 | 40 | 40 | Opposition |
| 1989 | 6th Assembly | 93,561 | 23 | 34 | 40 | Government |
| 1993 | 7th Assembly | 106,320 | 16 | 28 | 40 | Government |
| 1998 | 8th Assembly | 100,608 | 6 | 40 | 40 | Opposition |
| 2003 | 9th Assembly | 125,690 | 12 | 40 | 40 | Opposition |
| 2008 | 10th Assembly | 195,614 | 32 | 40 | 40 | Government |
| 2013 | 11th Assembly | 255,917 | 34 | 40 | 40 | Government |
| 2018 | 12th Assembly | 190,412 | 5 | 40 | 40 | Opposition |
| 2023 | 13th Assembly | 146,113 | 1 | 40 | 40 | Opposition |
General Assembly
| Year | General Election | Votes Polled | Seats Won | Seat Contested | Total Seats |
|---|---|---|---|---|---|
| 1977 | 6th Lok Sabha | 37,342 | 0 | 1 | 1 |
| 1989 | 9th Lok Sabha | 109,571 | 1 | 1 | 1 |
| 1991 | 10th Lok Sabha | 91,612 | 1 | 1 | 1 |
| 1996 | 11th Lok Sabha | 126,191 | 1 | 1 | 1 |
| 1998 | 12th Lok Sabha | 106,511 | 0 | 1 | 1 |
| 1999 | 11th Lok Sabha | - | - | - | 1 |
| 2004 | 14th Lok Sabha | - | - | - | 1 |
| 2009 | 15th Lok Sabha | - | 1 | 1 | 1 |
| 2014 | 16th Lok Sabha | - | 1 | 1 | 1 |
| 2019 | 17th Lok Sabha | - | tbc | tbc | 1 |
Nagaland
Legislative Assembly
| Year | Assembly Election | Votes Polled | Seats Won | Seat Contested | Total Seats |
|---|---|---|---|---|---|
| 1964 | 1st Assembly | - | - | - | 40 |
| 1969 | 2nd Assembly | - | - | - | 40 |
| 1974 | 3rd Assembly | - | - | - | 40 |
| 1977 | 4th Assembly | 65,616 | 15 | - | 60 |
| 1982 | 5th Assembly | 140,420 | 24 | - | 60 |
| 1987 | 6th Assembly | 193,199 | 34 | - | 60 |
| 1989 | 7th Assembly | 253,792 | 36 | - | 60 |
| 1993 | 8th Assembly | 335,834 | 35 | - | 60 |
| 1998 | 9th Assembly | 103,206 | 53 | - | 60 |
| 2003 | 10th Assembly | 318,671 | 21 | - | 60 |
| 2008 | 11th Assembly | 411,100 | 23 | - | 60 |
| 2013 | 12h Assembly | 272,515 | 8 | - | 60 |
| 2018 | 13th Assembly | 20,752 | 0 | 18 | 60 |
| 2023 | 14th Assembly | 40,810 | 0 | 23 | 60 |
General Assembly
| Year | General Election | Votes Polled | Seats Won | Seat Contested | Total Seats |
|---|---|---|---|---|---|
| 1977 | 6th Lok Sabha | 116,527 | 0 | 0 | 1 |
| 1984 | 8th Lok Sabha | 251,101 | 1 | 1 | 1 |
| 1989 | 9th Lok Sabha | 363,071 | 1 | 1 | 1 |
| 1991 | 10th Lok Sabha | 276,161 | 0 | 1 | 1 |
| 1996 | 11th Lok Sabha | 472,102 | 1 | 1 | 1 |
| 1998 | 12th Lok Sabha | 344,223 | 1 | 1 | 1 |
| 1999 | 13th Lok Sabha | 516,119 | 1 | 1 | 1 |
| 2004 | 14th Lok Sabha | 246,109 | 0 | 1 | 1 |
| 2009 | 15th Lok Sabha | 349,203 | 0 | 1 | 1 |
| 2014 | 16th Lok Sabha | 313,147 | 0 | 1 | 1 |
| 2019 | 17th Lok Sabha | 4,84,166 | 0 | 1 | 1 |
Odisha
Assembly Elections
| Year | Assembly Election | Votes Polled | Seats Won | Seat Contested | Total Seats |
|---|---|---|---|---|---|
| 1951 | 1st Assembly | 1,392,501 | 67 | 135 | 140 |
| 1957 | 2nd Assembly | 1,628,180 | 56 | 140 | 140 |
| 1961 | 3rd Assembly | 1,269,000 | 82 | 140 | 140 |
| 1967 | 4th Assembly | 1,235,149 | 31 | 140 | 140 |
| 1971 | 5th Assembly | 1,240,668 | 51 | 129 | 140 |
| 1974 | 6th Assembly | 2,152,818 | 69 | 135 | 146 |
| 1977 | 7th Assembly | 1,594,505 | 26 | 146 | 147 |
| 1980 | 8th Assembly | 3,037,487 | 118 | 147 | 147 |
| 1985 | 9th Assembly | 4,007,258 | 117 | 147 | 147 |
| 1990 | 10th Assembly | 3,264,000 | 10 | 145 | 147 |
| 1995 | 11th Assembly | 6,180,237 | 80 | 146 | 147 |
| 2000 | 12th Assembly | 4,770,654 | 26 | 145 | 147 |
| 2004 | 13th Assembly | 5,896,713 | 38 | 134 | 147 |
| 2009 | 14th Assembly | - | 17 | 145 | 147 |
| 2014 | 15th Assembly | 5,535,670 | 16 | - | 147 |
| 2019 | 16th Assembly | 37,75,320 | 9 | 147 | 147 |
General Elections
| Year | General Election | Votes Polled | Seats Won | Seat Contested | Total Seats |
|---|---|---|---|---|---|
| 1951 | 1st Lok Sabha | 1,555,787 | 11 | - | 20 |
| 1957 | 2nd Lok Sabha | 1,776,767 | 7 | - | 20 |
| 1962 | 3rd Lok Sabha | 1,093,297 | 14 | - | 20 |
| 1967 | 4th Lok Sabha | 1,353,704 | 6 | - | 20 |
| 1971 | 5th Lok Sabha | 1,716,021 | 15 | - | 20 |
| 1977 | 6th Lok Sabha | 2,059,490 | 4 | - | 21 |
| 1980 | 7th Lok Sabha | 3,451,255 | 20 | - | 21 |
| 1984 | 8th Lok Sabha | 4,692,933 | 20 | - | 21 |
| 1989 | 9th Lok Sabha | 4,298,516 | 3 | - | 21 |
| 1991 | 10th Lok Sabha | 4,598,809 | 13 | - | 21 |
| 1996 | 11th Lok Sabha | 5,850,025 | 17 | - | 21 |
| 1998 | 12th Lok Sabha | 5,477,410 | 5 | - | 21 |
| 1999 | 13th Lok Sabha | 4,901,186 | 2 | - | 21 |
| 2004 | 14th Lok Sabha | 6,845,738 | 2 | - | 21 |
| 2009 | 15th Lok Sabha | - | 6 | - | 21 |
| 2014 | 16th Lok Sabha | - | 0 | - | 21 |
| 2019 | 17th Lok Sabha | 32,85,192 | 1 | 21 | 21 |
Puducherry
Legislative Assembly
| Electoral performance of Congress in Puducherry Assembly |
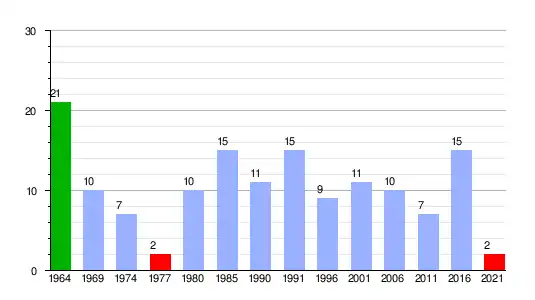 |
| Highest seats in Year:1964 Lowest seats in Year:1977, 2021
|
| Year | Assembly Election | Votes Polled | Seats Won | Seat Contested | Total Seats | Outcome |
|---|---|---|---|---|---|---|
| 1963[note 1] | 1st Assembly | N.A. | 21 | 39 | 39 | Government |
| 1964 | 2nd Assembly | 91,338 | 22 | 30 | 30 | Government |
| 1969 | 3rd Assembly | - | 10 | - | 30 | |
| 1974 | 4th Assembly | - | 7 | - | 30 | |
| 1977 | 5th Assembly | 39,343 | 2 | - | 30 | |
| 1980 | 6th Assembly | 58,680 | 10 | - | 30 | |
| 1985 | 7th Assembly | 98,601 | 15 | - | 30 | Government |
| 1990 | 8th Assembly | 105,207 | 11 | - | 30 | |
| 1991 | 9th Assembly | 117,289 | 15 | - | 30 | Government |
| 1996 | 10th Assembly | 116,618 | 9 | - | 30 | |
| 2001 | 11th Assembly | 108,700 | 11 | - | 30 | Government |
| 2006 | 12th Assembly | 10 | - | 30 | Government | |
| 2011 | 13th Assembly | 7 | 17 | 30 | Opposition | |
| 2016 | 14th Assembly | 244,886 | 15 | 21 | 30 | Government |
| 2021 | 15th Assembly | 2 | 14 | 30 |
General Elections
| Year | General Election | Votes Polled | Seats Won | Seat Contested | Total Seats |
|---|---|---|---|---|---|
| 1980 | 7th Lok Sabha | 164,589 | 1 | 1 | 1 |
| 1984 | 8th Lok Sabha | 159,376 | 1 | 1 | 1 |
| 1989 | 9th Lok Sabha | 190,562 | 1 | 1 | 1 |
| 1991 | 10th Lok Sabha | 207,922 | 1 | 1 | 1 |
| 1996 | 11th Lok Sabha | 1,986 | 1 | 1 | 1 |
| 1998 | 12th Lok Sabha | 131,348 | 0 | 1 | 1 |
| 1999 | 13th Lok Sabha | 165,108 | 1 | 1 | 1 |
| 2004 | 13th Lok Sabha | - | 1 | 1 | 1 |
| 2009 | 15th Lok Sabha | - | 1 | 1 | 1 |
| 2014 | 16th Lok Sabha | - | 0 | 1 | 1 |
| 2019 | 17th Lok Sabha | 444,981 | 1 | 1 | 1 |
Punjab
Legislative Assembly Election
| Year | Assembly Election | Votes Polled | Vote Percent | Seats Won | Seat Change | Outcome |
|---|---|---|---|---|---|---|
| 1951 | 1st Assembly | 1,830,601 | N.A. | 96 / 126 | Government | |
| 1957 | 2nd Assembly | 3,612,709 | N.A. | 120 / 154 | Government | |
| 1962 | 3rd Assembly | 2,946,209 | N.A. | 90 / 154 | Government | |
| 1967 | 4th Assembly | 1,594,160 | N.A. | 48 / 104 | Opposition | |
| 1969 | 5th Assembly | 1,844,360 | N.A. | 38 / 104 | Opposition | |
| 1972 | 6th Assembly | 2,083,390 | N.A. | 66 / 104 | Government | |
| 1977 | 7th Assembly | 1,899,534 | N.A. | 17 / 117 | Opposition | |
| 1980 | 8th Assembly | 2,825,827 | N.A. | 63 / 117 | Government | |
| 1985 | 9th Assembly | 2,620,042 | N.A. | 32 / 117 | Opposition | |
| 1992 | 10th Assembly | 1,317,075 | N.A. | 87 / 117 | Government | |
| 1997 | 11th Assembly | 2,736,346 | N.A. | 14 / 117 | Opposition | |
| 2002 | 12th Assembly | 3,682,877 | N.A. | 62 / 117 | Government | |
| 2007 | 13h Assembly | 5,170,548 | 40.90% | 44 / 117 | Opposition | |
| 2012 | 14th Assembly | 5,572,643 | 40.11% ( | 46 / 117 | Opposition | |
| 2017 | 15th Assembly | 5,945,899 | 38.64% ( | 77 / 117 | Government | |
| 2022 | 16th Assembly | 3,576,684 | 22.98% ( | 18 / 117 | Opposition |
General Election
| Year | General Election | Votes Polled | Seats Won | Seat Contested | Change |
|---|---|---|---|---|---|
| 1951 | 1st Lok Sabha | 2,134,586 | 16 | - | - |
| 1957 | 2nd Lok Sabha | 3,682,219 | 21 | - | - |
| 1962 | 3rd Lok Sabha | 2,802,692 | 14 | - | - |
| 1967 | 4th Lok Sabha | 1,598,546 | 9 | - | - |
| 1971 | 5th Lok Sabha | 1,873,862 | 10 | - | - |
| 1977 | 6th Lok Sabha | 1,955,485 | 0 | - | - |
| 1980 | 7th Lok Sabha | 3,133,473 | 12 | - | - |
| 1985 | 8th Lok Sabha | 2,879,089 | 6 | - | - |
| 1989 | 9th Lok Sabha | 2,103,712 | 2 | - | - |
| 1992 | 10th Lok Sabha | 1,486,289 | 12 | - | - |
| 1996 | 11th Lok Sabha | 3,098,956 | 2 | - | - |
| 1998 | 12th Lok Sabha | 2,356,281 | 0 | - | - |
| 1999 | 13th Lok Sabha | 3,365,176 | 2 | - | - |
| 2004 | 14th Lok Sabha | 3,495,187 | 2 / 13 | 13 | |
| 2009 | 15th Lok Sabha | - | 8 / 13 | 13 | |
| 2014 | 16th Lok Sabha | - | 3 / 13 | 13 | |
| 2019 | 17th Lok Sabha | 5,523,066 | 8 / 13 [6] | 13[7] |
Rajasthan
Legislative Assembly Elections
| Year | Assembly Election | Votes Polled | Vote Percent | Seat Contested | Seats Won | Seat Change | Outcome |
|---|---|---|---|---|---|---|---|
| 1951 | 1st Assembly | 1,286,953 | 51.25% | 156 | 82 / 160 | Government | |
| 1957 | 2nd Assembly | 2,141,931 | 67.61% | 176 | 119 / 176 | Government | |
| 1962 | 3rd Assembly | 2,052,383 | 39.98% | N.A. | 88 / 176 | Government | |
| 1967 | 4th Assembly | 2,798,411 | 41.42% | N.A. | 89 / 184 | Government | |
| 1972 | 5th Assembly | 3,976,157 | 51.13% | N.A. | 145 / 184 | Government | |
| 1977 | 6th Assembly | 2,599,772 | 31.49% | N.A. | 41 / 200 | Opposition | |
| 1980 | 7th Assembly | 3,975,315 | 42.96% | N.A. | 133 / 200 | Government | |
| 1985 | 8th Assembly | 5,342,920 | 46.67% | N.A. | 113 / 200 | Government | |
| 1990 | 9th Assembly | 4,988,699 | 33.67% | N.A. | 50 / 200 | Opposition | |
| 1993 | 10th Assembly | 6,442,721 | 38.27% | N.A. | 76 / 200 | Opposition | |
| 1998 | 11th Assembly | 8,467,160 | 44.95% | N.A. | 153 / 200 | Government | |
| 2003 | 12th Assembly | 8,120,605 | N.A. | 200 | 56 / 200 | Opposition | |
| 2008 | 13th Assembly | 8,872,184 | 36.82% | 200 | 96 / 200 | Government | |
| 2013 | 14th Assembly | 10,204,694 | 33.07% | 200 | 21 / 200 | Opposition | |
| 2018 | 15th Assembly | 13,935,201 | 39.3% | 200 | 100 / 200 | Government | |
| 2023 | 16th Assembly | 15,761,681 | 39.53% | 200 | 70 / 200 | Opposition |
General Elections
| Year | General Election | Votes Polled | Seats Won | Seat Contested | Total Seats |
|---|---|---|---|---|---|
| 1951 | 1st Lok Sabha | 1,460,971 | 9 | - | 20 |
| 1957 | 2nd Lok Sabha | 2,494,094 | 19 | - | 22 |
| 1962 | 3rd Lok Sabha | 1,951,507 | 14 | - | 22 |
| 1967 | 4th Lok Sabha | 2,722,493 | 10 | - | 23 |
| 1971 | 5th Lok Sabha | 3,486,776 | 14 | - | 23 |
| 1977 | 6th Lok Sabha | 2,568,345 | 1 | - | 25 |
| 1980 | 7th Lok Sabha | 4,040,398 | 18 | - | 25 |
| 1984 | 8th Lok Sabha | 5,898,116 | 25 | - | 25 |
| 1989 | 9th Lok Sabha | 5,285,868 | 0 | - | 25 |
| 1991 | 10th Lok Sabha | 5,407,144 | 13 | - | 25 |
| 1996 | 11th Lok Sabha | 5,253,531 | 12 | - | 25 |
| 1998 | 12th Lok Sabha | 7,846,072 | 18 | - | 25 |
| 1999 | 13th Lok Sabha | 7,475,888 | 9 | - | 25 |
| 2004 | 14th Lok Sabha | 7,179,939 | 4 | - | 25 |
| 2009 | 15th Lok Sabha | - | 20 | - | 25 |
| 2014 | 16th Lok Sabha | - | 0 | - | 25 |
| 2019 | 17th Lok Sabha | 11,107,910 | 0 | 25 | 25 |
Sikkim
Legislative Assembly Election
| Year | Assembly Election | Votes Polled | Seats Won | Seat Contested | Total Seats |
|---|---|---|---|---|---|
| 1979 | 1st Assembly | 1,476 | 0 | 12 | 32 |
| 1985 | 2nd Assembly | 23,440 | 1 | 32 | 32 |
| 1989 | 3rd Assembly | 24,121 | 0 | 31 | 32 |
| 1994 | 4th Assembly | 26,045 | 2 | 31 | 32 |
| 1999 | 5th Assembly | 7,512 | 0 | 31 | 32 |
| 2004 | 6th Assembly | 51,329 | 1 | 28 | 32 |
| 2009 | 7th Assembly | 69,612 | 0 | 32 | 32 |
| 2014 | 8th Assembly | 4,390 | 0 | 32 | 32 |
| 2019 | 9th Assembly | 2,721 | 0 | 24 | 32 |
General Election
| Year | General Election | Votes Polled | Seats Won | Seat Contested | Total Seats |
|---|---|---|---|---|---|
| 1984 | 8th Lok Sabha | 21,327 | 0 | 1 | 1 |
| 1989 | 9th Lok Sabha | 28,822 | 0 | 1 | 1 |
| 1998 | 12th Lok Sabha | 51,611 | 0 | 1 | 1 |
| 1999 | 13th Lok Sabha | 9,762 | 0 | 1 | 1 |
| 2004 | 14th Lok Sabha | 60,258 | 0 | 1 | 1 |
| 2009 | 15th Lok Sabha | - | 0 | 1 | 1 |
| 2014 | 16th Lok Sabha | - | 0 | 1 | 1 |
| 2019 | 17th Lok Sabha | 3,990 | 0 | 1 | 1 |
Tamil Nadu
Legislative Assembly Election
As Madras State
| Year | Assembly Election | Votes Polled | Seats Won | Seat Contested | Total Seats |
|---|---|---|---|---|---|
| 1951 | 1st Assembly | 6,988,701 | 152 | 367 | 375 |
| 1957 | 2nd Assembly | 5,046,576 | 151 | 204 | 205 |
| 1962 | 3rd Assembly | 5,848,974 | 139 | 206 | 206 |
| 1967 | 4th Assembly | 6,293,378 | 51 | 232 | 234 |
As Tamil Nadu
| Year | Assembly Election | Votes Polled | Seats Won | Seat Contested | Total Seats |
|---|---|---|---|---|---|
| 1971 | 5th Assembly | 5,513,894 | 15 | 201 | 234 |
| 1977 | 6th Assembly | 2,994,535 | 27 | 198 | 234 |
| 1980 | 7th Assembly | 3,941,900 | 31 | 114 | 234 |
| 1984 | 8th Assembly | 3,529,708 | 61 | 73 | 234 |
| 1989 | 9th Assembly | 4,780,714 | 26 | 214 | 234 |
| 1991 | 10th Assembly | 3,743,859 | 60 | 65 | 234 |
| 1996 | 11th Assembly | 1,523,340 | 0 | 64 | 234 |
| 2001 | 12th Assembly | 696,205 | 7 | 14 | 234 |
| 2006 | 13th Assembly | 2,765,768 | 34 | 48 | 234 |
| 2011 | 14th Assembly | 3,426,432 | 5 | 63 | 234 |
| 2016 | 15th Assembly | 2,774,075 | 8 | 41 | 234 |
| 2021 | 16th Assembly | 1,976,527 | 18 | 25 | 234 |
General Election
As Madras State
| Year | General Election | Votes Polled | Seats Won | Seat Contested | Total Seats |
|---|---|---|---|---|---|
| 1951 | 1st Lok Sabha | 7,253,452 | 35 | - | |
| 1957 | 2nd Lok Sabha | 5,094,552 | 31 | - | |
| 1962 | 3rd Lok Sabha | 5,623,013 | 31 | - | |
| 1967 | 4th Lok Sabha | 6,436,710 | 3 | - |
As Tamil Nadu
| Year | General Election | Votes Polled | Seats Won | Seat Contested | Total Seats |
|---|---|---|---|---|---|
| 1971 | 5th Lok Sabha | 1,995,567 | 9 | - | |
| 1977 | 6th Lok Sabha | 3,977,306 | 14 | 16 | 39 |
| 1980 | 7th Lok Sabha | 5,821,411 | 20 | 22 | 39 |
| 1984 | 8th Lok Sabha | 8,755,871 | 25 | 26 | 39 |
| 1989 | 9th Lok Sabha | 10,524,027 | 27 | 28 | 39 |
| 1991 | 10th Lok Sabha | 10,510,569 | 28 | 28 | 39 |
| 1996 | 11th Lok Sabha | 4,965,364 | 0 | 29 | 39 |
| 1998 | 12th Lok Sabha | 1,223,102 | 0 | 35 | 39 |
| 1999 | 13th Lok Sabha | 3,022,107 | 2 | 11 | 39 |
| 2004 | 14th Lok Sabha | 4,134,255 | 10 | 10 | 39 |
| 2009 | 15th Lok Sabha | - | 8 | 15 | 39 |
| 2014 | 16th Lok Sabha | - | 0 | 39 | 39 |
| 2019 | 17th Lok Sabha | 5,405,674 | 8 | 9 | 39 |
Telangana
Legislative Assembly Election
| Year | Assembly Election | Votes Polled | Vote Percent | Seat Contested | Seats Won | Seat Change | Outcome |
|---|---|---|---|---|---|---|---|
| 2014 | 1st Assembly | N.A. | N.A. | N.A. | 14 / 119 | Opposition | |
| 2018 | 2nd Assembly | 5,883,111 | 28.4 | 99 | 19 / 119 | Opposition | |
| 2023 | 3rd Assembly | 9,235,792 | 39.40 | 118 | 64 / 119 | Government |
General Election
| Year | General Election | Votes Polled | Seats Won | Seat Contested | Total Seats |
|---|---|---|---|---|---|
| 2014 | 16th Lok Sabha | N.A. | 2 | N.A. | 17 |
| 2019 | 17th Lok Sabha | - | 3 | 17 | 17 |
Tripura
Legislative Assembly Election
| Year | Assembly Election | Votes Polled | Seats Won | Seat Contested | Total Seats |
|---|---|---|---|---|---|
| 1963 | 1st Assembly | N.A. | N.A. | N.A. | N>A. |
| 1967 | 2nd Assembly | 251,345 | 27 | 30 | 30 |
| 1972 | 3rd Assembly | 224,821 | 41 | 59 | 60 |
| 1978 | 4th Assembly | 133,240 | 0 | 60 | 60 |
| 1983 | 5th Assembly | 282,859 | 12 | 45 | 60 |
| 1988 | 6th Assembly | 424,241 | 25 | 46 | 60 |
| 1993 | 7th Assembly | 438,561 | 10 | 46 | 60 |
| 1998 | 8th Assembly | 464,171 | 13 | 45 | 60 |
| 2003 | 9th Assembly | 498,749 | 13 | 60 | 60 |
| 2008 | 10th Assembly | 684,207 | 10 | 48 | 60 |
| 2013 | 11th Assembly | 804,457 | 10 | - | 60 |
| 2018 | 12th Assembly | 41,325 | 0 | 59 | 60 |
| 2023 | 13th Assembly | 216,637 | 3 | 13 | 60 |
General Election
| Year | General Election | Votes Polled | Seats Won | Seat Contested | Total Seats |
|---|---|---|---|---|---|
| 1951 | 1st Lok Sabha | Not Available | 0 | 2 | 2 |
| 1957 | 2nd Lok Sabha | Not Available | 1 | 2 | 2 |
| 1962 | 3rd Lok Sabha | Not Available | 0 | 2 | 2 |
| 1967 | 4th Lok Sabha | Not Available | 2 | 2 | 2 |
| 1971 | 5th Lok Sabha | Not Available | 0 | 2 | 2 |
| 1977 | 6th Lok Sabha | Not Available | 1 | 2 | 2 |
| 1980 | 7th Lok Sabha | Not Available | 0 | 2 | 2 |
| 1984 | 8th Lok Sabha | Not Available | 0 | 2 | 2 |
| 1989 | 9th Lok Sabha | Not Available | 2 | 2 | 2 |
| 1991 | 10th Lok Sabha | Not Available | 2 | 2 | 2 |
| 1996 | 11th Lok Sabha | Not Available | 0 | 2 | 2 |
| 1998 | 12th Lok Sabha | Not Available | 0 | 2 | 2 |
| 1999 | 13th Lok Sabha | Not Available | 0 | 2 | 2 |
| 2004 | 14th Lok Sabha | Not Available | 0 | 2 | 2 |
| 2009 | 15th Lok Sabha | Not Available | 0 | 2 | 2 |
| 2014 | 16th Lok Sabha | Not Available | 0 | 2 | 2 |
| 2019 | 17th Lok Sabha | 5,45,679 | 0 | 2 | 2 |
Uttar Pradesh
Legislative Assembly Elections
| Year | Legislature | Leader | Seats Contested | Seats won | Change in seats | Votes | Percentage of votes | Vote swing | Outcome |
|---|---|---|---|---|---|---|---|---|---|
| 1952 | 1st Assembly | Govind Vallabh Pant | 429 | 388 / 430 |
- | 8,032,475 | 47.93 | - | Government |
| 1957 | 2nd Assembly | Sampurnanand | 430 | 286 / 430 |
9,298,382 | 42.42 | Government | ||
| 1962 | 3rd Assembly | Chandra Bhanu Gupta | 429 | 249 / 430 |
6,471,669 | 36.35 | Government | ||
| 1967 | 4th Assembly | Chandra Bhanu Gupta | 425 | 199 / 425 |
6,912,104 | 32.20 | Government | ||
| 1969 | 5th Assembly | Chandra Bhanu Gupta | 424 | 211 / 425 |
7,893,152 | 33.69 | |||
| 1974 | 6th Assembly | Hemwati Nandan Bahuguna | 403 | 215 / 424 |
8,868,229 | 32.29 | Government | ||
| 1977 | 7th Assembly | 395 | 47 / 425 |
7,592,107 | 31.94 | Opposition | |||
| 1980 | 8th Assembly | V. P. Singh | 424 | 309 / 425 |
9,720,767 | 37.65 | Government | ||
| 1985 | 9th Assembly | Narayan Datt Tiwari | 425 | 269 / 425 |
11,544,698 | 39.25 | Government | ||
| 1989 | 10th Assembly | Narayan Datt Tiwari | 410 | 94 / 425 |
10,866,428 | 27.90 | Opposition | ||
| 1991 | 11th Assembly | Narayan Datt Tiwari | 413 | 46 / 419 |
6,480,753 | 17.32 | Opposition | ||
| 1993 | 12th Assembly | 421 | 28 / 422 |
7,533,272 | 15.08 | Opposition | |||
| 1996 | 13th Assembly | 126 | 33 / 424 |
4,626,663 | 8.35 | Opposition | |||
| 2002 | 14th Assembly | Pramod Tiwari | 402 | 25 / 403 |
4,810,231 | 8.96 | Opposition | ||
| 2007 | 15th Assembly | Sonia Gandhi | 393 | 22 / 403 |
4,489,234 | 8.61 | Opposition | ||
| 2012 | 16th Assembly | Raj Babbar | 355 | 28 / 403 |
8,832,895 | 11.65 | Opposition | ||
| 2017 | 17th Assembly | 114 | 7 / 403 |
5,416,324 | 6.25 | Opposition | |||
| 2022 | 18th Assembly | Priyanka Gandhi | 399 | 2 / 403 |
2,151,234 | 2.33 | Opposition |
General Election
| Year | General Election | Votes Polled | Seats Won | Seat Contested | Total Seats |
|---|---|---|---|---|---|
| 1951 | 1st Lok Sabha | 9,047,392 | 81 | - | 85 |
| 1957 | 2nd Lok Sabha | 10,599,639 | 70 | - | 85 |
| 1962 | 3rd Lok Sabha | 6,842,472 | 62 | - | 85 |
| 1967 | 4th Lok Sabha | 7,285,130 | 47 | - | 85 |
| 1971 | 5th Lok Sabha | 9,981,309 | 73 | - | 85 |
| 1977 | 6th Lok Sabha | 7,170,182 | 0 | - | 85 |
| 1980 | 7th Lok Sabha | 10,171,194 | 51 | - | 85 |
| 1984 | 8th Lok Sabha | 17,391,831 | 83 | - | 85 |
| 1989 | 9th Lok Sabha | 12,393,934 | 15 | - | 85 |
| 1991 | 10th Lok Sabha | 6,755,015 | 5 | - | 85 |
| 1996 | 11th Lok Sabha | 3,746,505 | 5 | - | 85 |
| 1998 | 12th Lok Sabha | 3,361,053 | 0 | - | 85 |
| 1999 | 13th Lok Sabha | 8,001,685 | 10 | - | 85 |
| 2004 | 14th Lok Sabha | 6,412,293 | 9 | - | 80 |
| 2009 | 15th Lok Sabha | data not available | 21 | - | 80 |
| 2014 | 16th Lok Sabha | data not available | 2 | 80 | |
| 2019 | 17th Lok Sabha | 54,57,269 | 1 | 67 | 80 |
Uttarakhand
Legislative Assembly Election
| Year | Assembly Election | Votes Polled | Seats Won | Seat Contested | Total Seats |
|---|---|---|---|---|---|
| 2002 | 1st Vidhan Sabha | 7,69,991 | 36 | 70 | 70 |
| 2007 | 2nd Vidhan Sabha | 1,116,511 | 21 | 70 | 70 |
| 2012 | 3rd Vidhan Sabha | 14,36,042 | 32 | 70 | 70 |
| 2017 | 4th Vidhan Sabha | 16,65,664 | 11 | 70 | 70 |
| 2022 | 5th Vidhan Sabha | 20,38,509 | 19 | 70 | 70 |
General Election
| Year | General Election | Votes Polled | Seats Won | Seat Contested | Total Seats |
|---|---|---|---|---|---|
| 2004 | 14th Lok Sabha | 1,024,062 | 1 | 5 | 5 |
| 2009 | 15th Lok Sabha | 1,354,468 | 5 | 5 | 5 |
| 2014 | 16th Lok Sabha | 1,494,440 | 0 | 5 | 5 |
| 2019 | 17th Lok Sabha | 15,20,767 | 0 | 5 | 5 |
West Bengal
Legislative Assembly Elections
| Year | Assembly Election | Votes Polled | Seats Won | Seat Contested | Total Seats |
|---|---|---|---|---|---|
| 1951 | 1st Assembly | 2,889,994 | 150 | 236 | 238 |
| 1957 | 2nd Assembly | 4,830,992 | 152 | 251 | 252 |
| 1962 | 3rd Assembly | 4,522,476 | 157 | 252 | 252 |
| 1967 | 4th Assembly | 5,207,930 | 127 | 280 | 280 |
| 1969 | 5th Assembly | 5,538,622 | 55 | - | 280 |
| 1971 | 6th Assembly | 3,767,314 | 105 | - | 280 |
| 1972 | 7th Assembly | 6,543,251 | 216 | - | 280 |
| 1977 | 8th Assembly | 3,298,063 | 20 | - | 294 |
| 1982 | 9th Assembly | 8,035,272 | 49 | 250 | 294 |
| 1987 | 10th Assembly | 10,989,520 | 40 | 294 | 294 |
| 1991 | 11th Assembly | 10,875,834 | 43 | 284 | 294 |
| 1996 | 12th Assembly | 14,523,964 | 82 | 288 | 294 |
| 2001 | 13th Assembly | 2,921,156 | 26 | 60 | 294 |
| 2006 | 14th Assembly | - | 21 | 262 | 294 |
| 2011 | 15th Assembly | - | 42 | 65 | 294 |
| 2016 | 16th Assembly | 6,700,938 | 44 | 92 | 295 |
| 2021 | 17th Assembly | 1,757,131 | 0 | 91 | 294 |
General Election
| Year | General Election | Votes Polled | Seats Won | Seat Contested | Total Seats |
|---|---|---|---|---|---|
| 1951 | 1st Lok Sabha | 3,205,162 | 24 | - | |
| 1957 | 2nd Lok Sabha | 5,031,696 | 23 | - | |
| 1962 | 3rd Lok Sabha | 4,553,677 | 22 | - | |
| 1967 | 4th Lok Sabha | 5,105,170 | 14 | - | |
| 1971 | 5th Lok Sabha | 3,687,665 | 13 | - | |
| 1977 | 6th Lok Sabha | 4,312,418 | 3 | - | |
| 1980 | 7th Lok Sabha | 7,500,578 | 4 | - | |
| 1984 | 8th Lok Sabha | 12,227,863 | 16 | - | |
| 1989 | 9th Lok Sabha | 13,100,945 | 4 | - | |
| 1991 | 10th Lok Sabha | 10,834,675 | 5 | - | |
| 1996 | 11th Lok Sabha | 14,711,538 | 9 | - | |
| 1998 | 12th Lok Sabha | 5,551,456 | 1 | - | |
| 1999 | 13th Lok Sabha | 4,688,932 | 3 | - | 42 |
| 2004 | 14th Lok Sabha | 5,385,754 | 6 | - | 42 |
| 2009 | 15th Lok Sabha | - | 6 | - | 42 |
| 2014 | 16th Lok Sabha | - | 4 | - | 42 |
| 2019 | 17th Lok Sabha | 32,10,485 | 2 | 42 | 42 |
Ajmer
| Year | General Election | Votes Polled | Seats Won | Seat Contested | Total Seats |
|---|---|---|---|---|---|
| 1951 | 1st Assembly | 104,411 | 20 | 30 | 30 |
| 1951 | 1st Lok Sabha | 89,761 | 2 |
Bhopal
| Year | General Election | Votes Polled | Seats Won | Seat Contested | Total Seats |
|---|---|---|---|---|---|
| 1951 | 1st Assembly | 117,656 | 25 | 28 | 30 |
| 1951 | 1st Lok Sabha | 97,292 | 2 |
Bombay
| Year | General Election | Votes Polled | Seats Won |
|---|---|---|---|
| 1951 | 1st Assembly | 5,556,334 | 269 |
| 1951 | 1st Lok Sabha | 5,781,277 | 40 |
| 1957 | 2nd Assembly | 8,131,604 | 234 |
| 1957 | 2nd Lok Sabha | 8,156,272 | 38 |
Coorg
| Year | General Election | Votes Polled | Seats Won | Seat Contested | Total Seats |
|---|---|---|---|---|---|
| 1951 | 1st Assembly | 48,845 | 15 | 24 | 24 |
| 1951 | 1st Lok Sabha | 38,063 | 1 |
Kutch
| Year | General Election | Votes Polled | Seats Won |
|---|---|---|---|
| 1951 | 1st Lok Sabha | 78,771 | 2 |
Madhya Bharat
| Year | General Election | Votes Polled | Seats Won | Seat Contested | Total Seats |
|---|---|---|---|---|---|
| 1951 | 1st Assembly | 938,918 | 75 | 99 | 99 |
| 1951 | 1st Lok Sabha | 992,159 | 9 |
Patiala and East Punjab States Union
| Year | General Election | Votes Polled | Seats Won | Seat Contested | Total Seats |
|---|---|---|---|---|---|
| 1951 | 1st Assembly | 388,185 | 26 | 51 | 60 |
| 1951 | 1st Lok Sabha | 492,408 | 2 | ||
| 1954 | 2nd Assembly | 696,979 | 37 |
Saurashtra
| Year | General Election | Votes Polled | Seats Won |
|---|---|---|---|
| 1951 | 1st Assembly | 606,934 | 55 |
| 1951 | 1st Lok Sabha | 506,112 | 6 |
Vindhya Pradesh
| Year | General Election | Votes Polled | Seats Won | Seat Contested | Total Seats |
|---|---|---|---|---|---|
| 1951 | 1st Assembly | 270,013 | 40 | 56 | 60 |
| 1951 | 1st Lok Sabha | 238,220 | 4 | ||
| 1957 | 2nd Lok Sabha | 253,241 | 1 |
Notes
- ↑ The Representative Assembly was converted into the Legislative Assembly of Pondicherry on 1 July 1963 and its members were deemed to have been elected to the Assembly.[5]: 966 Thus, the First Legislative Assembly was formed without an election. Elections for the assembly have been held since 1964.
References
- ↑ "Election Commission of India".
- ↑ "Election Commission of India".
- ↑ "Election Commission of India".
- ↑ "Election Commission of India".
- ↑ Cabinet Responsibility to Legislature. Metropolitan Book Co. Pvt. Ltd. 1964. p. 464. ISBN 9788120004009.
{{cite book}}:|work=ignored (help) - ↑ "Punjab Lok Sabha Election Result 2019: Congress wins maximum seats as Sunny Deol champions for BJP".
- ↑ http://ceopunjab.nic.in/english/result2019.aspx.
{{cite web}}: Missing or empty|title=(help)
This article is issued from Wikipedia. The text is licensed under Creative Commons - Attribution - Sharealike. Additional terms may apply for the media files.