| |||||||||||||||||||||||||||||||||||||||||||||||||||
All 23 seats to East Lothian Council 12 seats needed for a majority | |||||||||||||||||||||||||||||||||||||||||||||||||||
|---|---|---|---|---|---|---|---|---|---|---|---|---|---|---|---|---|---|---|---|---|---|---|---|---|---|---|---|---|---|---|---|---|---|---|---|---|---|---|---|---|---|---|---|---|---|---|---|---|---|---|---|
| |||||||||||||||||||||||||||||||||||||||||||||||||||
| |||||||||||||||||||||||||||||||||||||||||||||||||||
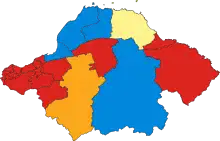
Map showing results by ward.
Elections to East Lothian Council were held on 1 May 2003, the same day as the other Scottish local government elections and the Scottish Parliament general election.
Election results
| Party | Seats | Gains | Losses | Net gain/loss | Seats % | Votes % | Votes | +/− | |
|---|---|---|---|---|---|---|---|---|---|
| Labour | 17 | 0 | 0 | 40.6 | 15,061 | ||||
| Conservative | 4 | 0 | 1 | 23.1 | 8,561 | ||||
| SNP | 1 | 0 | 0 | 19.2 | 7,132 | ||||
| Liberal Democrats | 1 | 1 | 0 | 14.9 | 5,503 | ||||
| Scottish Socialist | 0 | 0 | 0 | 0.0 | 1.6 | 589 | New | ||
| Independent | 0 | 0 | 0 | 0.0 | 0.6 | 210 | New | ||
Ward results
Labour
- Musselburgh West
- Musselburgh South
- Musselburgh North
- Musselburgh Central
- Musselburgh East
- Wallyford/Whitecraig
- Prestonpans West
- Prestonpans East
- Cockenzie and Port Seaton
- Tranent West
- Tranent/Macmerry
- Tranent/Elphinestone
- Ormiston/Pencaitland
- Haddington Central
- Haddington East/Athelstaneford
- Dunbar/West Barns
- Dunbar East
Conservative
- Longniddry
- Aberlady/Dirleton/Gullane
- East Linton/Gifford
- North Berwick West
Lib Dem
- Haddington West/Saltoun
SNP
- North Berwick East
References
This article is issued from Wikipedia. The text is licensed under Creative Commons - Attribution - Sharealike. Additional terms may apply for the media files.