Cavillargues | |
|---|---|
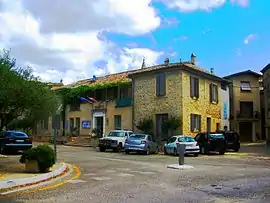 The town hall of Cavillargues | |
.svg.png.webp) Coat of arms | |
Location of Cavillargues | |
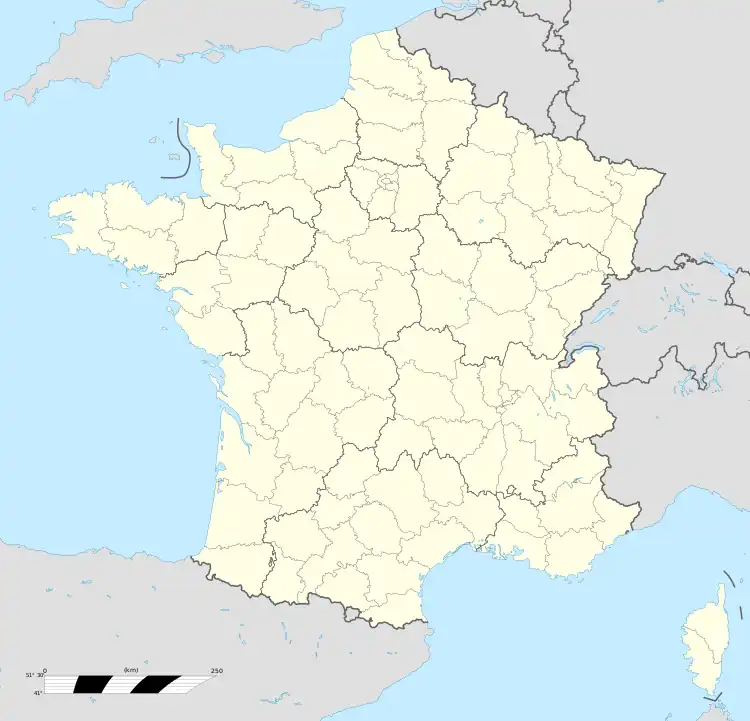 Cavillargues 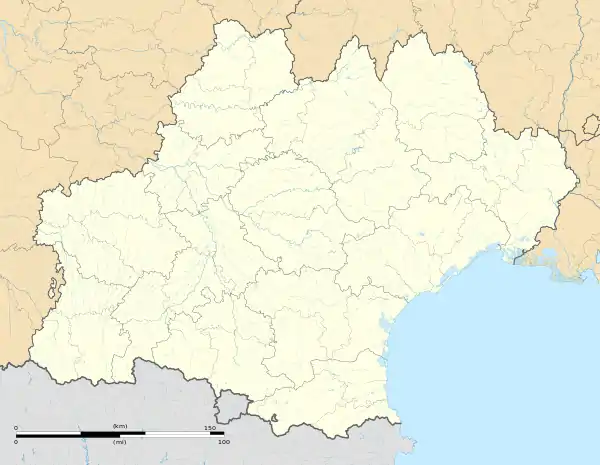 Cavillargues | |
| Coordinates: 44°06′54″N 4°31′22″E / 44.115°N 4.5227°E | |
| Country | France |
| Region | Occitania |
| Department | Gard |
| Arrondissement | Nîmes |
| Canton | Bagnols-sur-Cèze |
| Intercommunality | CA Gard Rhodanien |
| Government | |
| • Mayor (2020–2026) | Laurent Nadal[1] |
| Area 1 | 11.27 km2 (4.35 sq mi) |
| Population | 846 |
| • Density | 75/km2 (190/sq mi) |
| Time zone | UTC+01:00 (CET) |
| • Summer (DST) | UTC+02:00 (CEST) |
| INSEE/Postal code | 30076 /30330 |
| Elevation | 105–262 m (344–860 ft) (avg. 137 m or 449 ft) |
| 1 French Land Register data, which excludes lakes, ponds, glaciers > 1 km2 (0.386 sq mi or 247 acres) and river estuaries. | |
Cavillargues (French pronunciation: [kavijaʁɡ]; Occitan: Cavilhargas) is a commune in the Gard department in southern France.
Geography
Climate
Cavillargues has a hot-summer Mediterranean climate (Köppen climate classification Csa). The average annual temperature in Cavillargues is 14.1 °C (57.4 °F). The average annual rainfall is 845.8 mm (33.30 in) with November as the wettest month. The temperatures are highest on average in August, at around 23.4 °C (74.1 °F), and lowest in January, at around 5.8 °C (42.4 °F). The highest temperature ever recorded in Cavillargues was 41.5 °C (106.7 °F) on 28 June 2019; the coldest temperature ever recorded was −15.0 °C (5.0 °F) on 5 January 1971.
| Climate data for Cavillargues (1991−2020 normals, extremes 1961−present) | |||||||||||||
|---|---|---|---|---|---|---|---|---|---|---|---|---|---|
| Month | Jan | Feb | Mar | Apr | May | Jun | Jul | Aug | Sep | Oct | Nov | Dec | Year |
| Record high °C (°F) | 21.6 (70.9) |
24.2 (75.6) |
28.0 (82.4) |
30.5 (86.9) |
34.2 (93.6) |
41.5 (106.7) |
39.8 (103.6) |
41.0 (105.8) |
36.2 (97.2) |
31.1 (88.0) |
24.0 (75.2) |
21.1 (70.0) |
41.5 (106.7) |
| Mean daily maximum °C (°F) | 10.3 (50.5) |
11.9 (53.4) |
16.2 (61.2) |
19.2 (66.6) |
23.5 (74.3) |
27.9 (82.2) |
30.8 (87.4) |
30.8 (87.4) |
25.4 (77.7) |
20.1 (68.2) |
14.1 (57.4) |
10.7 (51.3) |
20.1 (68.2) |
| Daily mean °C (°F) | 5.8 (42.4) |
6.7 (44.1) |
10.1 (50.2) |
12.9 (55.2) |
16.9 (62.4) |
20.9 (69.6) |
23.3 (73.9) |
23.4 (74.1) |
18.9 (66.0) |
14.8 (58.6) |
9.6 (49.3) |
6.4 (43.5) |
14.1 (57.4) |
| Mean daily minimum °C (°F) | 1.3 (34.3) |
1.4 (34.5) |
4.0 (39.2) |
6.6 (43.9) |
10.3 (50.5) |
13.9 (57.0) |
15.9 (60.6) |
15.9 (60.6) |
12.4 (54.3) |
9.5 (49.1) |
5.0 (41.0) |
2.0 (35.6) |
8.2 (46.8) |
| Record low °C (°F) | −15.0 (5.0) |
−14.0 (6.8) |
−10.6 (12.9) |
−3.6 (25.5) |
−0.2 (31.6) |
4.0 (39.2) |
6.2 (43.2) |
5.6 (42.1) |
1.9 (35.4) |
−2.5 (27.5) |
−8.4 (16.9) |
−14.0 (6.8) |
−15.0 (5.0) |
| Average precipitation mm (inches) | 74.3 (2.93) |
44.0 (1.73) |
51.7 (2.04) |
73.3 (2.89) |
66.6 (2.62) |
45.2 (1.78) |
38.0 (1.50) |
47.0 (1.85) |
107.0 (4.21) |
119.0 (4.69) |
120.8 (4.76) |
58.9 (2.32) |
845.8 (33.30) |
| Average precipitation days (≥ 1.0 mm) | 6.6 | 5.1 | 4.9 | 7.1 | 6.9 | 5.1 | 3.6 | 4.4 | 5.7 | 7.2 | 8.5 | 6.6 | 71.6 |
| Source: Météo-France[3] | |||||||||||||
Population
| Year | Pop. | ±% |
|---|---|---|
| 1962 | 495 | — |
| 1968 | 510 | +3.0% |
| 1975 | 445 | −12.7% |
| 1982 | 492 | +10.6% |
| 1990 | 601 | +22.2% |
| 1999 | 645 | +7.3% |
| 2008 | 772 | +19.7% |
| 2011 | 806 | +4.4% |
See also
References
- ↑ "Répertoire national des élus: les maires". data.gouv.fr, Plateforme ouverte des données publiques françaises (in French). 2 December 2020.
- ↑ "Populations légales 2021". The National Institute of Statistics and Economic Studies. 28 December 2023.
- ↑ "Fiche Climatologique Statistiques 1991-2020 et records" (PDF) (in French). Météo-France. Retrieved 1 September 2022.
External links
Wikimedia Commons has media related to Cavillargues.
This article is issued from Wikipedia. The text is licensed under Creative Commons - Attribution - Sharealike. Additional terms may apply for the media files.