Courniou | |
|---|---|
 View | |
.svg.png.webp) Coat of arms | |
Location of Courniou | |
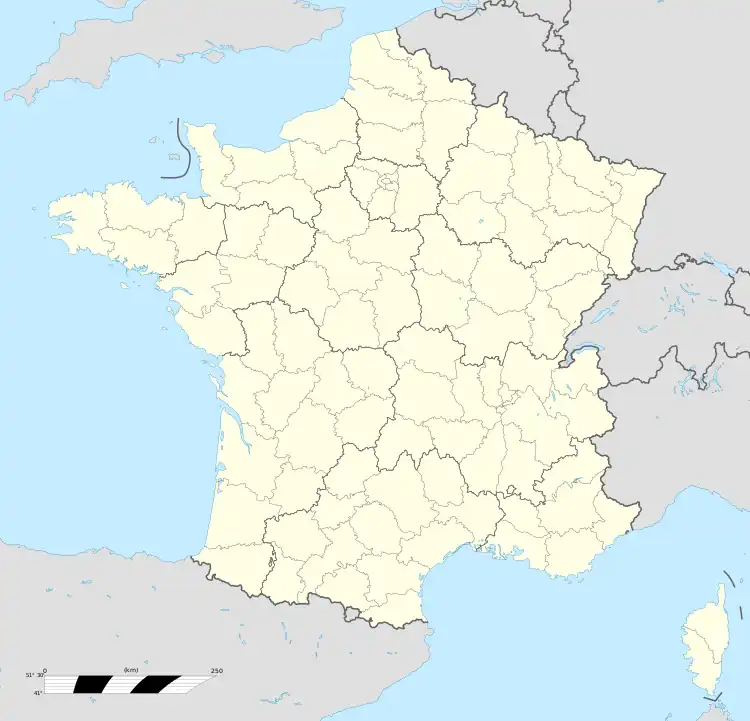 Courniou 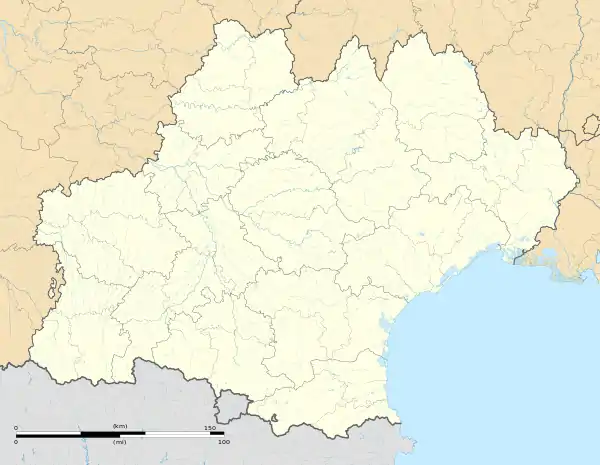 Courniou | |
| Coordinates: 43°28′28″N 2°42′45″E / 43.4744°N 2.7125°E | |
| Country | France |
| Region | Occitania |
| Department | Hérault |
| Arrondissement | Béziers |
| Canton | Saint-Pons-de-Thomières |
| Government | |
| • Mayor (2020–2026) | Catherine Sonzogni[1] |
| Area 1 | 30.06 km2 (11.61 sq mi) |
| Population | 616 |
| • Density | 20/km2 (53/sq mi) |
| Time zone | UTC+01:00 (CET) |
| • Summer (DST) | UTC+02:00 (CEST) |
| INSEE/Postal code | 34086 /34220 |
| Elevation | 329–951 m (1,079–3,120 ft) (avg. 362 m or 1,188 ft) |
| 1 French Land Register data, which excludes lakes, ponds, glaciers > 1 km2 (0.386 sq mi or 247 acres) and river estuaries. | |
Courniou (French pronunciation: [kuʁnju]; Occitan: Cornhon) is a commune in the Hérault department in southern France.
Geography
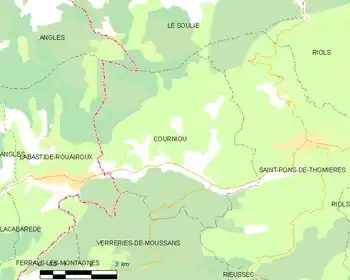
Map
Climate
Courniou has a warm-summer mediterranean climate (Köppen climate classification Csb). The average annual temperature in Courniou is 11.9 °C (53.4 °F). The average annual rainfall is 1,444.7 mm (56.88 in) with December as the wettest month. The temperatures are highest on average in July, at around 20.2 °C (68.4 °F), and lowest in January, at around 4.8 °C (40.6 °F). The highest temperature ever recorded in Courniou was 39.3 °C (102.7 °F) on 12 August 2003; the coldest temperature ever recorded was −15.5 °C (4.1 °F) on 16 January 1985.
| Climate data for Courniou (1981–2010 averages, extremes 1971−2014) | |||||||||||||
|---|---|---|---|---|---|---|---|---|---|---|---|---|---|
| Month | Jan | Feb | Mar | Apr | May | Jun | Jul | Aug | Sep | Oct | Nov | Dec | Year |
| Record high °C (°F) | 19.9 (67.8) |
23.0 (73.4) |
26.5 (79.7) |
28.2 (82.8) |
31.8 (89.2) |
36.0 (96.8) |
35.9 (96.6) |
39.3 (102.7) |
33.0 (91.4) |
29.1 (84.4) |
24.5 (76.1) |
22.0 (71.6) |
39.3 (102.7) |
| Mean daily maximum °C (°F) | 8.0 (46.4) |
8.8 (47.8) |
11.9 (53.4) |
14.3 (57.7) |
18.5 (65.3) |
22.6 (72.7) |
25.8 (78.4) |
25.6 (78.1) |
21.7 (71.1) |
16.8 (62.2) |
11.4 (52.5) |
8.6 (47.5) |
16.2 (61.2) |
| Daily mean °C (°F) | 4.8 (40.6) |
5.3 (41.5) |
7.8 (46.0) |
9.9 (49.8) |
13.7 (56.7) |
17.4 (63.3) |
20.2 (68.4) |
20.0 (68.0) |
16.6 (61.9) |
12.9 (55.2) |
8.1 (46.6) |
5.5 (41.9) |
11.9 (53.4) |
| Mean daily minimum °C (°F) | 1.7 (35.1) |
1.8 (35.2) |
3.7 (38.7) |
5.6 (42.1) |
8.9 (48.0) |
12.1 (53.8) |
14.5 (58.1) |
14.4 (57.9) |
11.5 (52.7) |
9.1 (48.4) |
4.9 (40.8) |
2.3 (36.1) |
7.6 (45.7) |
| Record low °C (°F) | −15.5 (4.1) |
−11.7 (10.9) |
−12.5 (9.5) |
−2.5 (27.5) |
−1.2 (29.8) |
3.5 (38.3) |
5.5 (41.9) |
5.0 (41.0) |
−0.3 (31.5) |
−2.0 (28.4) |
−8.2 (17.2) |
−10.5 (13.1) |
−15.5 (4.1) |
| Average precipitation mm (inches) | 161.0 (6.34) |
148.5 (5.85) |
117.9 (4.64) |
151.6 (5.97) |
102.6 (4.04) |
58.0 (2.28) |
35.4 (1.39) |
60.5 (2.38) |
92.6 (3.65) |
162.8 (6.41) |
174.5 (6.87) |
179.3 (7.06) |
1,444.7 (56.88) |
| Average precipitation days (≥ 1.0 mm) | 13.6 | 12.4 | 12.0 | 12.4 | 10.0 | 7.0 | 5.1 | 6.5 | 7.8 | 11.9 | 12.7 | 12.7 | 124.0 |
| Source: Meteociel[3] | |||||||||||||
Population
| Year | Pop. | ±% |
|---|---|---|
| 1962 | 385 | — |
| 1968 | 529 | +37.4% |
| 1975 | 503 | −4.9% |
| 1982 | 537 | +6.8% |
| 1990 | 595 | +10.8% |
| 1999 | 606 | +1.8% |
| 2008 | 620 | +2.3% |
See also
References
- ↑ "Répertoire national des élus: les maires". data.gouv.fr, Plateforme ouverte des données publiques françaises (in French). 9 August 2021.
- ↑ "Populations légales 2021". The National Institute of Statistics and Economic Studies. 28 December 2023.
- ↑ "Normales et records pour Courniou (34)". Meteociel. Retrieved 5 June 2022.
Wikimedia Commons has media related to Courniou.
This article is issued from Wikipedia. The text is licensed under Creative Commons - Attribution - Sharealike. Additional terms may apply for the media files.